
- Start >
- Rivers >
- Waterlevel >
- Oberer Main - Elbe >
- Hohenberg >
- Chart of year

Chart of year Hohenberg / Eger
Waterlevel from 01.01.2023 to 31.12.2023
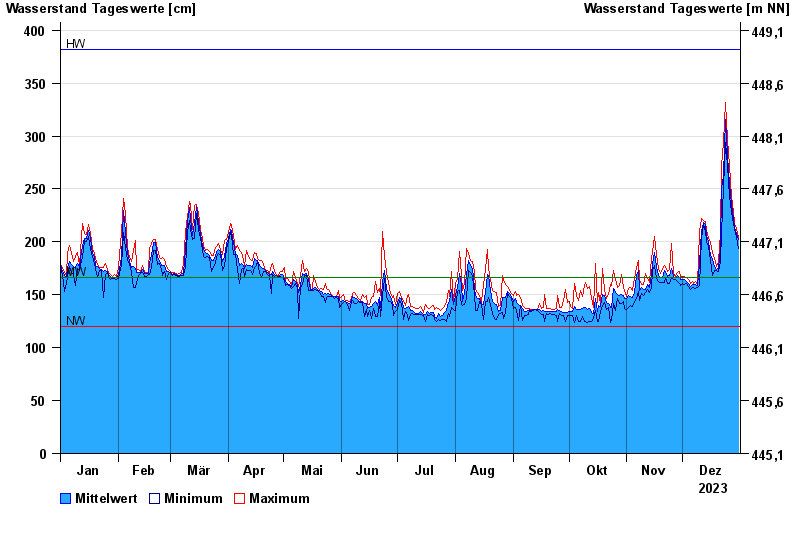
| Date | Mean value [cm] | Maximum [cm] | Minimum [cm] |
|---|---|---|---|
| 31.12.2023 | 202 | 204 | 194 |
| 30.12.2023 | 208 | 213 | 204 |
| 29.12.2023 | 214 | 217 | 212 |
| 28.12.2023 | 222 | 229 | 217 |
| 27.12.2023 | 235 | 243 | 228 |
| 26.12.2023 | 254 | 272 | 243 |
| 25.12.2023 | 282 | 297 | 272 |
© Bayerisches Landesamt für Umwelt 2024