
- Start >
- Rivers >
- Waterlevel >
- Oberer Main - Elbe >
- Heinersdorf >
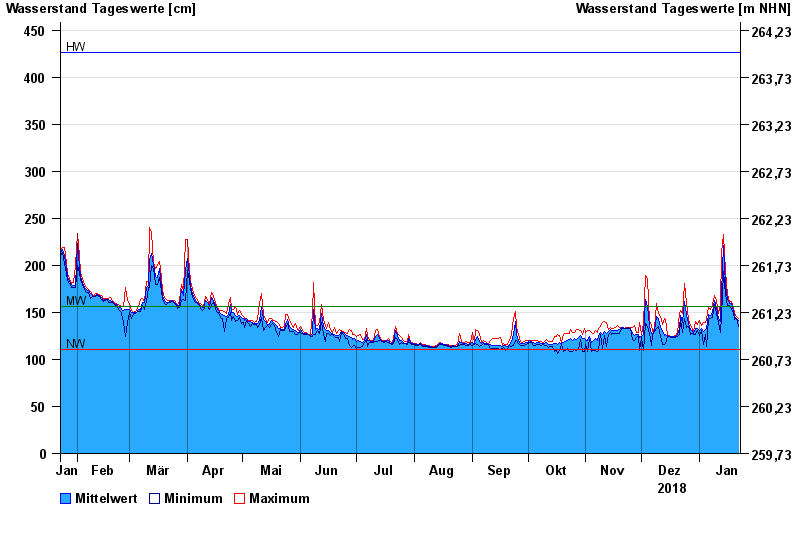
- Chart of year

Chart of year Heinersdorf / Rodach
Waterlevel from 23.01.2018 to 22.01.2019
| Date | Mean value [cm] | Maximum [cm] | Minimum [cm] |
|---|---|---|---|
| 22.01.2019 | 141 | 144 | 135 |
| 21.01.2019 | 144 | 146 | 143 |
| 20.01.2019 | 146 | 149 | 142 |
| 19.01.2019 | 152 | 155 | 149 |
| 18.01.2019 | 159 | 162 | 153 |
| 17.01.2019 | 159 | 161 | 157 |
| 16.01.2019 | 164 | 169 | 157 |
© Bayerisches Landesamt für Umwelt 2024