
- Start >
- Rivers >
- Waterlevel >
- Oberer Main - Elbe >
- Grafenwöhr >
- Chart of year

Chart of year Grafenwöhr / Creußen
Waterlevel from 01.01.2023 to 31.12.2023
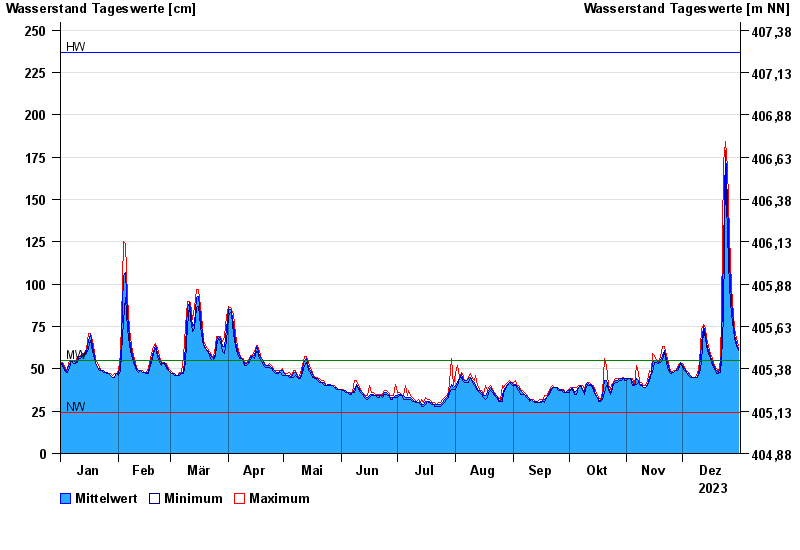
| Date | Mean value [cm] | Maximum [cm] | Minimum [cm] |
|---|---|---|---|
| 31.12.2023 | 62 | 64 | 61 |
| 30.12.2023 | 65 | 68 | 64 |
| 29.12.2023 | 70 | 74 | 68 |
| 28.12.2023 | 78 | 82 | 73 |
| 27.12.2023 | 89 | 98 | 82 |
| 26.12.2023 | 112 | 129 | 98 |
| 25.12.2023 | 149 | 169 | 129 |
© Bayerisches Landesamt für Umwelt 2024