
- Start >
- Rivers >
- Waterlevel >
- Oberer Main - Elbe >
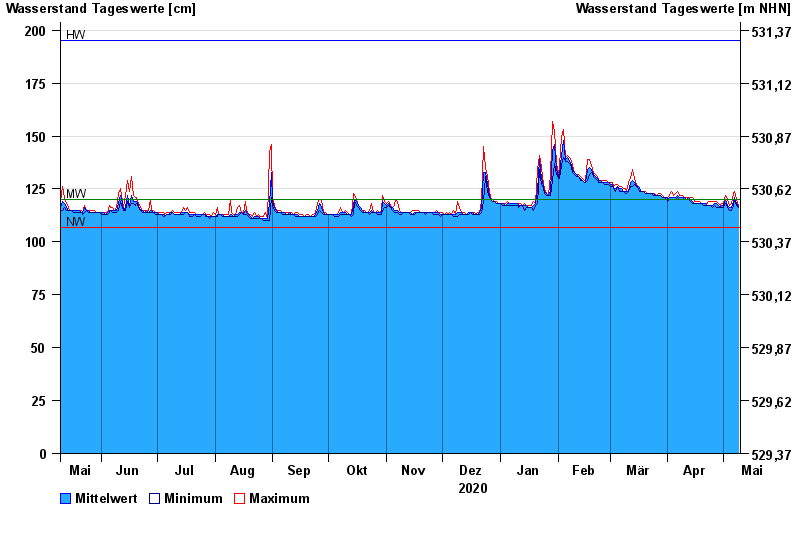
- Förmitz Speicherzufluss >
- Chart of year

Chart of year Förmitz Speicherzufluss / Förmitz
Waterlevel from 10.05.2020 to 09.05.2021
| Date | Mean value [cm] | Maximum [cm] | Minimum [cm] |
|---|---|---|---|
| 09.05.2021 | 116 | 117 | 116 |
| 08.05.2021 | 118 | 120 | 117 |
| 07.05.2021 | 121 | 124 | 120 |
| 06.05.2021 | 119 | 123 | 117 |
| 05.05.2021 | 116 | 118 | 115 |
| 04.05.2021 | 116 | 117 | 115 |
| 03.05.2021 | 117 | 120 | 116 |
© Bayerisches Landesamt für Umwelt 2024