
- Start >
- Rivers >
- Waterlevel >
- Oberer Main - Elbe >
- Förmitz Speicherzufluss >
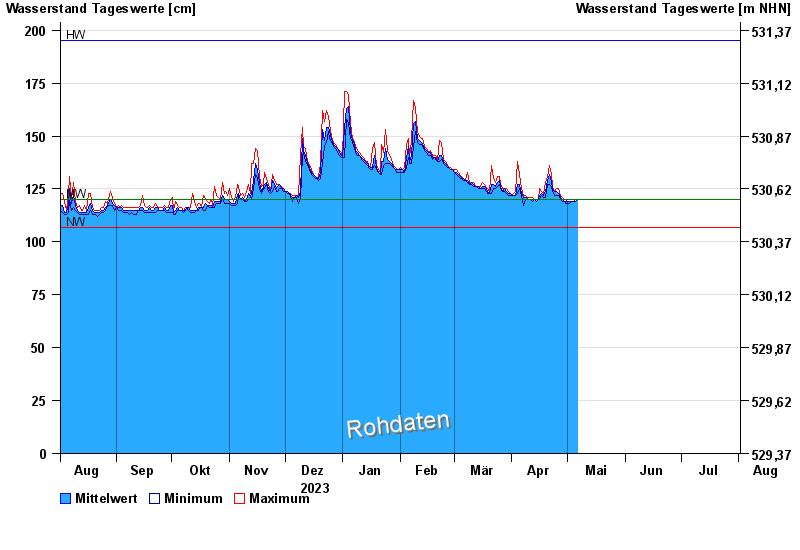
- Chart of year

Chart of year Förmitz Speicherzufluss / Förmitz
Waterlevel from 02.08.2023 to 01.08.2024
| Date | Mean value [cm] | Maximum [cm] | Minimum [cm] |
|---|---|---|---|
| 10.05.2024 | 123 | 126 | 119 |
| 09.05.2024 | 124 | 126 | 121 |
| 08.05.2024 | 125 | 129 | 123 |
| 07.05.2024 | 131 | 134 | 128 |
| 06.05.2024 | 123 | 127 | 121 |
| 05.05.2024 | 122 | 123 | 120 |
| 04.05.2024 | 122 | 123 | 120 |
© Bayerisches Landesamt für Umwelt 2024