
- Start >
- Rivers >
- Waterlevel >
- Oberer Main - Elbe >
- Erlabrück >
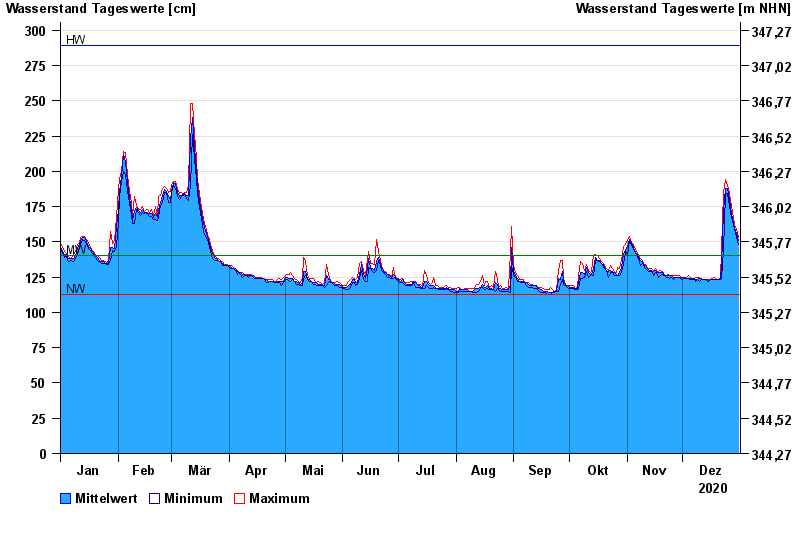
- Chart of year

Chart of year Erlabrück / Rodach
Waterlevel from 01.01.2020 to 31.12.2020
| Date | Mean value [cm] | Maximum [cm] | Minimum [cm] |
|---|---|---|---|
| 31.12.2020 | 151 | 153 | 148 |
| 30.12.2020 | 156 | 159 | 153 |
| 29.12.2020 | 160 | 162 | 159 |
| 28.12.2020 | 164 | 167 | 162 |
| 27.12.2020 | 170 | 175 | 167 |
| 26.12.2020 | 180 | 184 | 175 |
| 25.12.2020 | 188 | 190 | 184 |
© Bayerisches Landesamt für Umwelt 2024