
- Start >
- Rivers >
- Suspended sediment >
- Untere Donau >
- Bad Tölz Brücke >
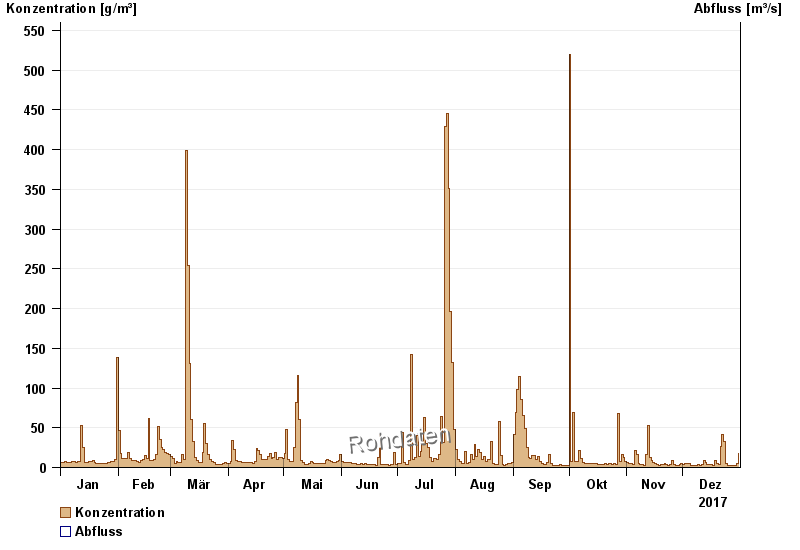
- Chart of year

Chart of year Bad Tölz Brücke / Isar
Suspended sediment from 01.01.2017 to 31.12.2017
| Date | concentration [g/m³] | Runoff [m³/s] |
|---|---|---|
| 31.12.2017 | 17.4 | 0.0 |
| 30.12.2017 | 4.4 | 0.0 |
| 29.12.2017 | 2.2 | 0.0 |
| 28.12.2017 | 2.6 | 0.0 |
| 27.12.2017 | 2.4 | 0.0 |
| 26.12.2017 | 2.3 | 0.0 |
| 25.12.2017 | 2.6 | 0.0 |
© Bayerisches Landesamt für Umwelt 2024