
- Start >
- Rivers >
- Discharge >
- Untere Donau >
- Passau Marienbrücke Q >
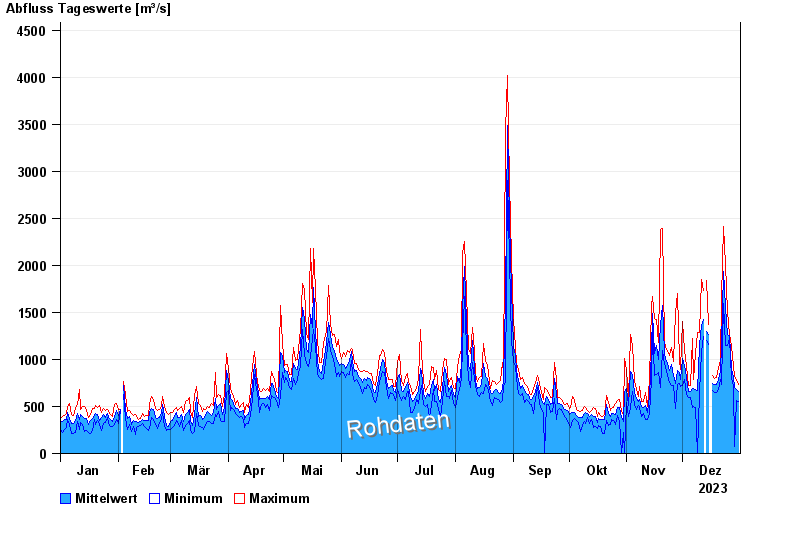
- Chart of year

Chart of year Passau Marienbrücke Q / Inn
Discharge from 01.01.2023 to 31.12.2023
 Für diesen Pegel sind keine Hauptwerte hinterlegt.
| Date | Mean value [m³/s] | Maximum [m³/s] | Minimum [m³/s] |
|---|---|---|---|
| 31.12.2023 | 656 | 734 | 552 |
| 30.12.2023 | 685 | 776 | 566 |
| 29.12.2023 | 701 | 819 | 77 |
| 28.12.2023 | 812 | 924 | 713 |
| 27.12.2023 | 905 | 1140 | 811 |
| 26.12.2023 | 1250 | 1270 | 1220 |
| 25.12.2023 | 1270 | 1510 | 1150 |
© Bayerisches Landesamt für Umwelt 2024