
- Start >
- Rivers >
- Discharge >
- Iller - Lech - Bodensee >
- Fallmühle >
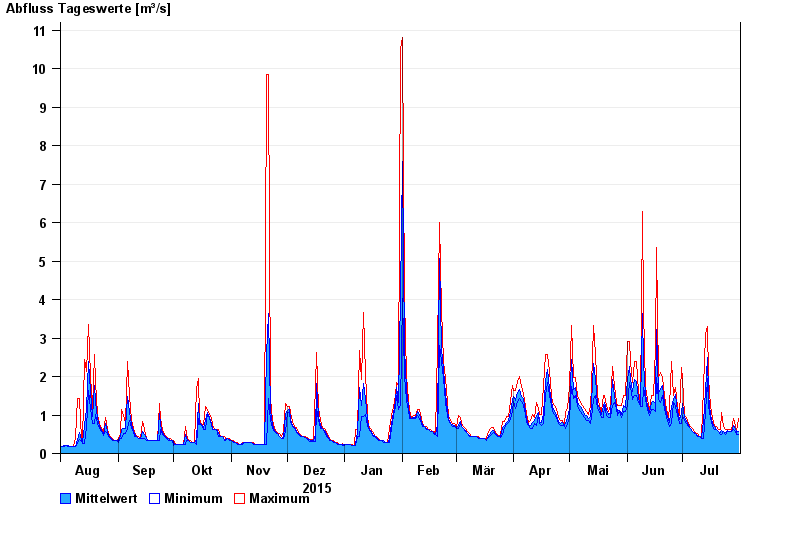
- Chart of year

Chart of year Fallmühle / Steinacher Achen
Discharge from 01.08.2015 to 31.07.2016
 Für diesen Pegel sind keine Hauptwerte hinterlegt.
| Date | Mean value [m³/s] | Maximum [m³/s] | Minimum [m³/s] |
|---|---|---|---|
| 31.07.2016 | 0.561 | 0.905 | 0.497 |
| 30.07.2016 | 0.54 | 0.559 | 0.497 |
| 29.07.2016 | 0.654 | 0.693 | 0.559 |
| 28.07.2016 | 0.723 | 0.906 | 0.625 |
| 27.07.2016 | 0.571 | 0.626 | 0.56 |
| 26.07.2016 | 0.584 | 0.626 | 0.56 |
| 25.07.2016 | 0.601 | 0.626 | 0.561 |
© Bayerisches Landesamt für Umwelt 2024