

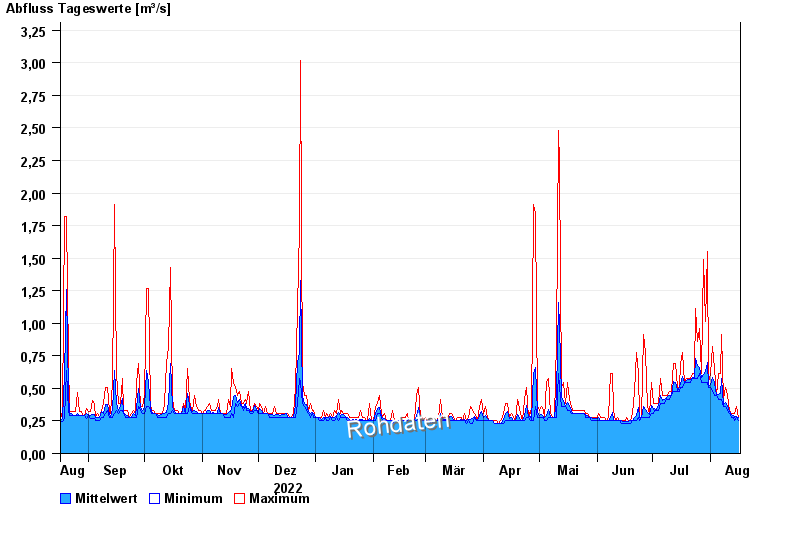
Chart of year Wolnzach / Wolnzach
Discharge from 17.08.2022 to 16.08.2023
 Für diesen Pegel sind keine Hauptwerte hinterlegt.
| Date | Mean value [m³/s] | Maximum [m³/s] | Minimum [m³/s] |
|---|---|---|---|
| 16.08.2023 | 0.276 | 0.279 | 0.255 |
| 15.08.2023 | 0.283 | 0.358 | 0.279 |
| 14.08.2023 | 0.28 | 0.304 | 0.255 |
| 13.08.2023 | 0.289 | 0.304 | 0.279 |
| 12.08.2023 | 0.302 | 0.304 | 0.279 |
| 11.08.2023 | 0.319 | 0.331 | 0.304 |
| 10.08.2023 | 0.369 | 0.445 | 0.331 |
© Bayerisches Landesamt für Umwelt 2024