

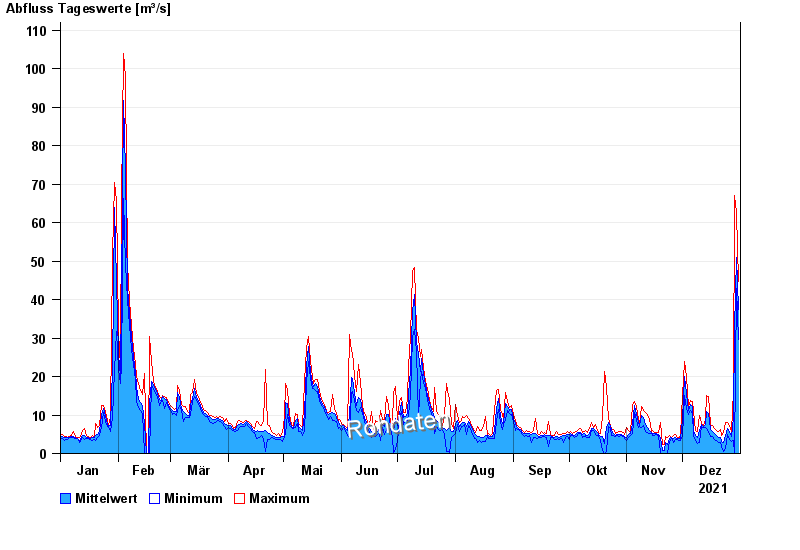
Chart of year Weiden Q / Waldnaab
Discharge from 01.01.2021 to 31.12.2021
 Für diesen Pegel sind keine Hauptwerte hinterlegt.
| Date | Mean value [m³/s] | Maximum [m³/s] | Minimum [m³/s] |
|---|---|---|---|
| 31.12.2021 | 37.5 | 44.6 | 29.7 |
| 30.12.2021 | 50.9 | 62.5 | 42.9 |
| 29.12.2021 | 32.6 | 67 | -- |
| 28.12.2021 | 9.25 | 16.5 | 3.32 |
| 27.12.2021 | 4.32 | 5.6 | 3.01 |
| 26.12.2021 | 5.44 | 7.25 | 3.75 |
| 25.12.2021 | 6.6 | 8.14 | 4.99 |
© Bayerisches Landesamt für Umwelt 2024