
- Start >
- Rivers >
- Chemistry >
- Regnitz >
- Wegbr. oh Mdg. >
- Chart of total period

Chart of total period Wegbr. oh Mdg. / Röthenbach
Data from 2018-01-03 to 2022-12-05
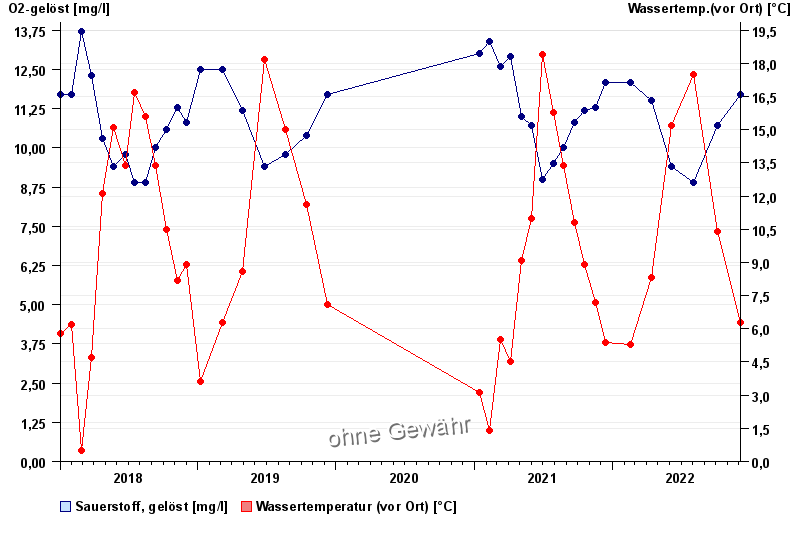
| Date | O2-gelöst [mg/l] | Wassertemp.(vor Ort) [°C] |
|---|---|---|
| 05.12.2022 | 11.7 | 6.3 |
| 04.10.2022 | 10.7 | 10.4 |
| 03.08.2022 | 8.9 | 17.5 |
| 07.06.2022 | 9.4 | 15.2 |
| 13.04.2022 | 11.5 | 8.3 |
| 16.02.2022 | 12.1 | 5.3 |
| 14.12.2021 | 12.1 | 5.4 |
© Bayerisches Landesamt für Umwelt 2024