
- Start >
- Rivers >
- Chemistry >
- Untere Donau >
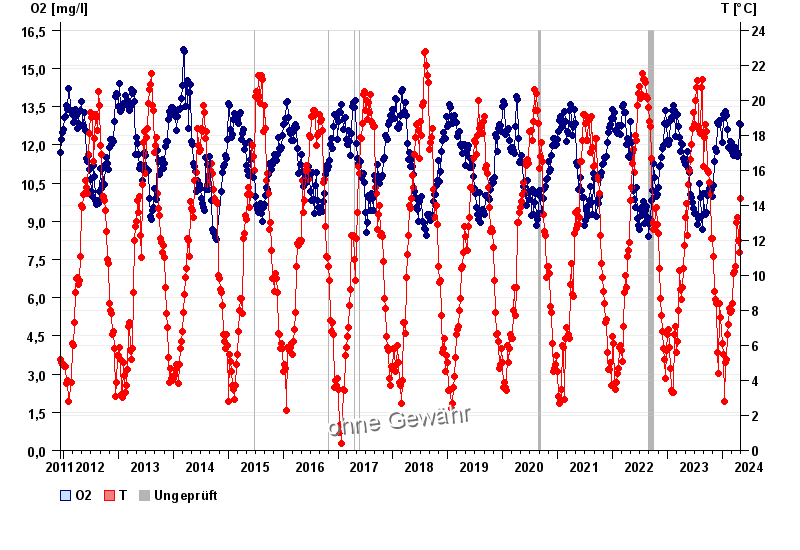
- Messstation Jochenstein >
- Chart of total period

Chart of total period Messstation Jochenstein / Donau
Data from 2011-12-12 to 2024-05-03
| Date | O2 [mg/l] | T [°C] |
|---|---|---|
| 03.05.2024 | 11.47 | 14.4 |
| 02.05.2024 | 12.01 | 14.2 |
| 01.05.2024 | 12.64 | 13.3 |
| 30.04.2024 | 12.79 | 12.3 |
| 29.04.2024 | 12.82 | 11.3 |
| 28.04.2024 | 12.70 | 10.4 |
| 27.04.2024 | 12.46 | 9.6 |
© Bayerisches Landesamt für Umwelt 2024