
- Start >
- Rivers >
- Chemistry >
- Obere Donau >
- Bad Abbach Pegel >
- Chart of year

Chart of year Bad Abbach Pegel / Donau
Data from 2017-01-01 to 2017-12-31
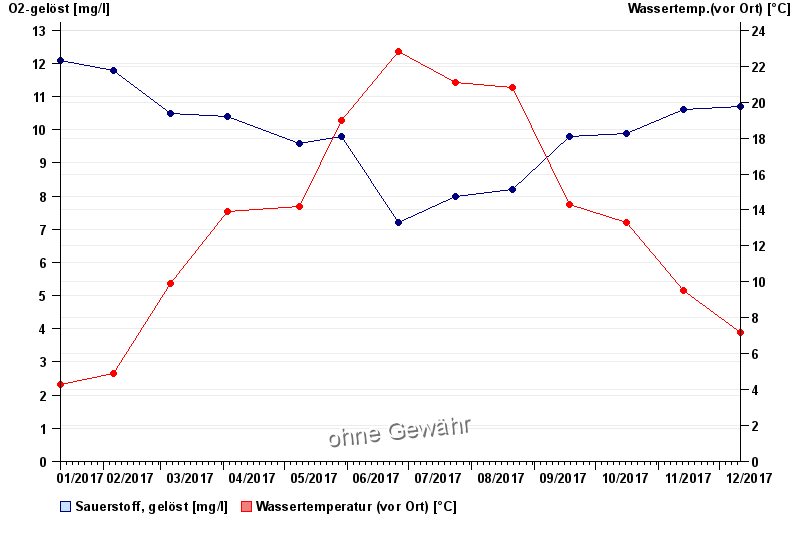
| Date | O2-gelöst [mg/l] | Wassertemp.(vor Ort) [°C] |
|---|---|---|
| 11.12.2017 | 10.7 | 7.2 |
| 13.11.2017 | 10.6 | 9.5 |
| 16.10.2017 | 9.9 | 13.3 |
| 18.09.2017 | 9.8 | 14.3 |
| 21.08.2017 | 8.2 | 20.8 |
| 24.07.2017 | 8 | 21.1 |
| 26.06.2017 | 7.2 | 22.8 |
© Bayerisches Landesamt für Umwelt 2024