
- Start >
- Rivers >
- Chemistry >
- Isar >
- Pegel Oberach >
- Chart of total period

Chart of total period Pegel Oberach / Weißach
Data from 2008-03-27 to 2020-12-16
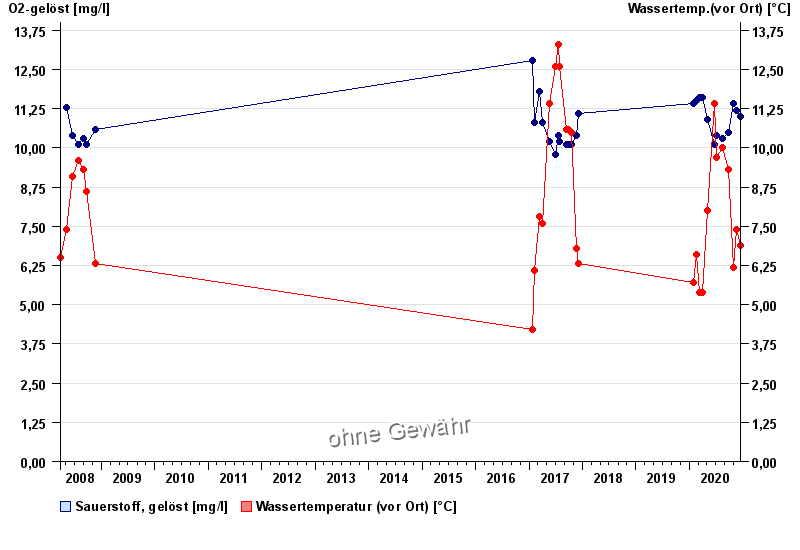
| Date | O2-gelöst [mg/l] | Wassertemp.(vor Ort) [°C] |
|---|---|---|
| 27.03.2008 | -- | 6.5 |
| 16.12.2020 | 11 | 6.9 |
| 19.11.2020 | 11.2 | 7.4 |
| 27.10.2020 | 11.4 | 6.2 |
| 22.09.2020 | 10.5 | 9.3 |
| 18.08.2020 | 10.3 | 10 |
| 08.07.2020 | 10.4 | 9.7 |
© Bayerisches Landesamt für Umwelt 2026