
- Start >
- Meteorology >
- Global radiation >
- Unterer Main >
- Hammelburg-Seeshof >
- Chart of year

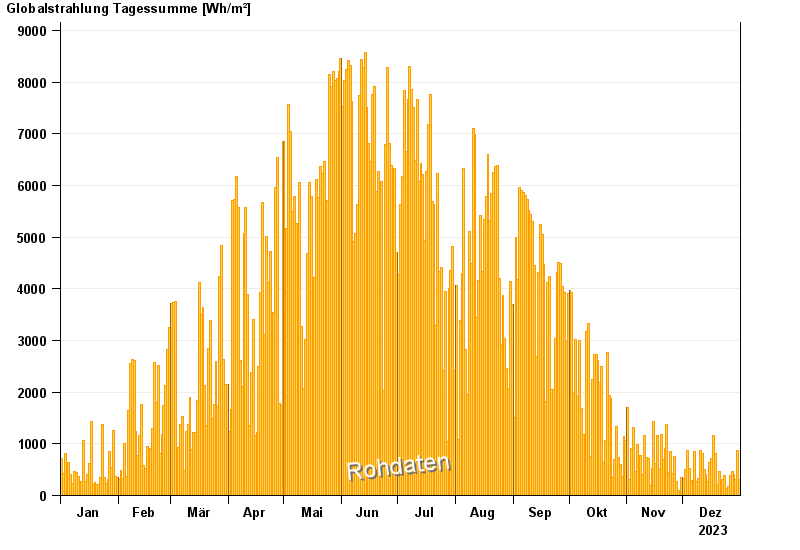
Chart of year Hammelburg-Seeshof
Global radiation from 01.01.2023 to 31.12.2023
| Date | Global radiation [Wh/m²] |
|---|---|
| 31.12.2023 | 316.3 |
| 30.12.2023 | 867.3 |
| 29.12.2023 | 313.4 |
| 28.12.2023 | 412.4 |
| 27.12.2023 | 466.4 |
| 26.12.2023 | 395.0 |
| 25.12.2023 | 174.7 |
© Bayerisches Landesamt für Umwelt 2025