
- Start >
- Meteorology >
- Global radiation >
- Inn >
- Nilling >
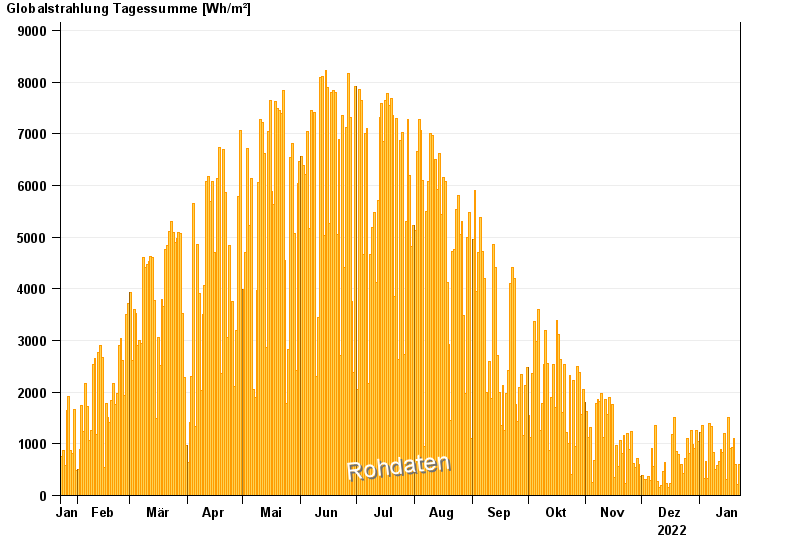
- Chart of year

Chart of year Nilling
Global radiation from 23.01.2022 to 22.01.2023
| Date | Global radiation [Wh/m²] |
|---|---|
| 22.01.2023 | 594.1 |
| 21.01.2023 | 206.8 |
| 20.01.2023 | 608.0 |
| 19.01.2023 | 1096.1 |
| 18.01.2023 | 929.1 |
| 17.01.2023 | 906.8 |
| 16.01.2023 | 1513.5 |
© Bayerisches Landesamt für Umwelt 2024