
- Start >
- Meteorology >
- Air temperature >
- Unterer Main >
- Fladungen-Leubach >
- Chart of year

Chart of year Fladungen-Leubach
Air temperatur from 01.01.2020 to 31.12.2020
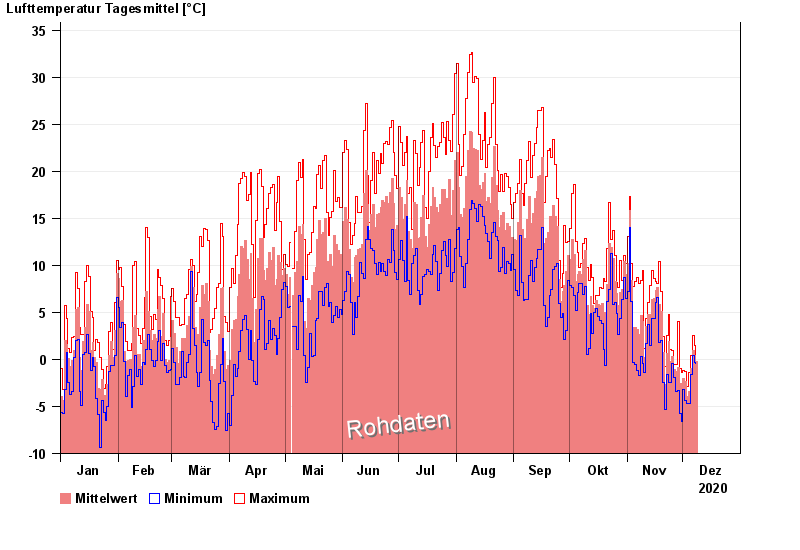
Note: The time series in the selected period has gaps.
| Date | Mean value [°C] | Maximum [°C] | Minimum [°C] |
|---|---|---|---|
| 08.12.2020 | -0.2 | -0.1 | -0.4 |
| 07.12.2020 | 0.4 | 1.5 | -0.3 |
| 06.12.2020 | 1.0 | 2.5 | 0.4 |
| 05.12.2020 | -1.0 | 0.4 | -1.6 |
| 04.12.2020 | -3.4 | -1.4 | -4.7 |
| 03.12.2020 | -3.9 | -2.9 | -4.7 |
| 02.12.2020 | -2.3 | -1.3 | -4.4 |
© Bayerisches Landesamt für Umwelt 2024