
- Start >
- Meteorology >
- Air pressure >
- Oberer Main - Elbe >
- Mauthaus (Klimastation) >
- Chart of year

Chart of year Mauthaus (Klimastation)
Air pressure from 01.01.2023 to 31.12.2023
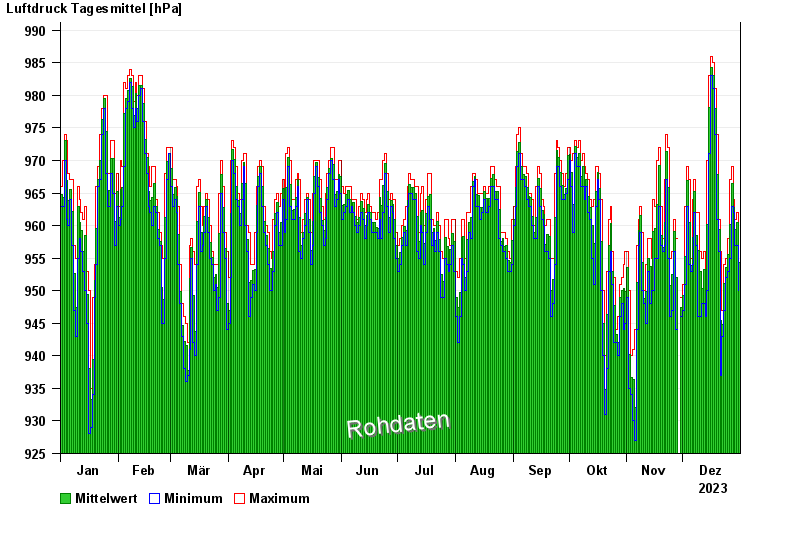
Note: The time series in the selected period has gaps.
| Date | Mean value [hPa] | Maximum [hPa] | Minimum [hPa] |
|---|---|---|---|
| 31.12.2023 | 954.3 | 960.0 | 950.0 |
| 30.12.2023 | 960.4 | 962.0 | 957.0 |
| 29.12.2023 | 959.4 | 961.0 | 957.0 |
| 28.12.2023 | 962.8 | 964.0 | 962.0 |
| 27.12.2023 | 966.4 | 969.0 | 963.0 |
| 26.12.2023 | 960.2 | 967.0 | 955.0 |
| 25.12.2023 | 955.6 | 958.0 | 953.0 |
© Bayerisches Landesamt für Umwelt 2025