
- Start >
- Meteorology >
- Air moisture >
- Regnitz >
- Buch >
- Chart of year

Chart of year Buch
Air moisture from 30.09.2019 to 29.09.2020
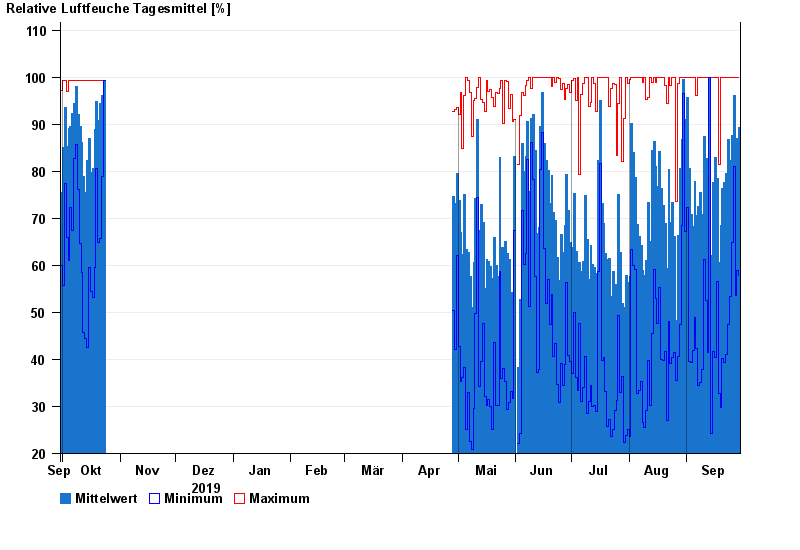
Note: The time series in the selected period has gaps.
| Date | Mean value [%] | Maximum [%] | Minimum [%] |
|---|---|---|---|
| 29.09.2020 | 89.4 | 100.0 | 57.9 |
| 28.09.2020 | 86.9 | 100.0 | 59.0 |
| 27.09.2020 | 83.9 | 100.0 | 53.6 |
| 26.09.2020 | 96.1 | 100.0 | 81.0 |
| 25.09.2020 | 87.6 | 100.0 | 64.8 |
| 24.09.2020 | 82.3 | 100.0 | 53.4 |
| 23.09.2020 | 86.7 | 100.0 | 47.4 |
© Bayerisches Landesamt für Umwelt 2024