
- Start >
- Meteorology >
- Air moisture >
- Unterer Main >
- Veitshöchheim >
- Chart of year

Chart of year Veitshöchheim
Air moisture from 01.01.2017 to 31.12.2017
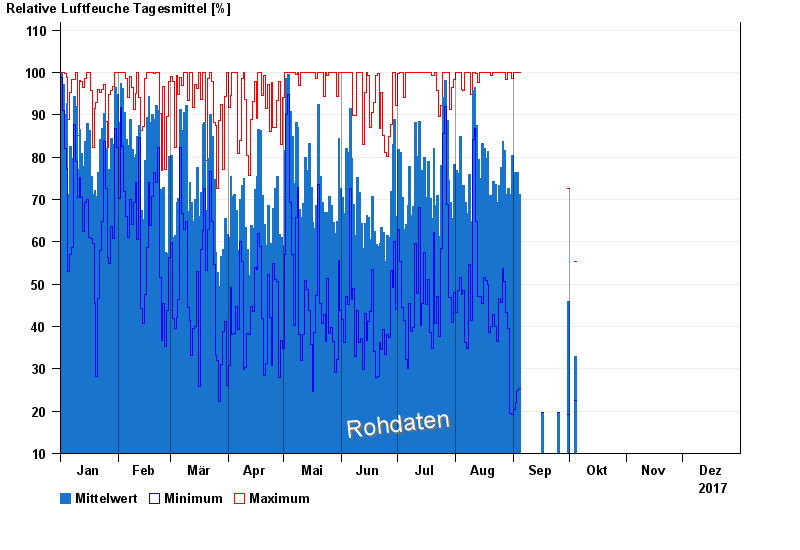
Note: The time series in the selected period has gaps.
| Date | Mean value [%] | Maximum [%] | Minimum [%] |
|---|---|---|---|
| 04.10.2017 | 33.0 | 55.3 | 22.6 |
| 30.09.2017 | 45.9 | 72.7 | 19.1 |
| 25.09.2017 | 19.6 | 19.6 | 19.6 |
| 16.09.2017 | 19.6 | 19.6 | 19.6 |
| 04.09.2017 | 71.3 | 99.9 | 25.3 |
| 03.09.2017 | 76.5 | 99.9 | 24.8 |
| 02.09.2017 | 76.0 | 99.9 | 22.0 |
© Bayerisches Landesamt für Umwelt 2024