
- Start >
- Meteorology >
- Air moisture >
- Unterer Main >
- Fladungen-Leubach >
- Chart of year

Chart of year Fladungen-Leubach
Air moisture from 28.10.2021 to 27.10.2022
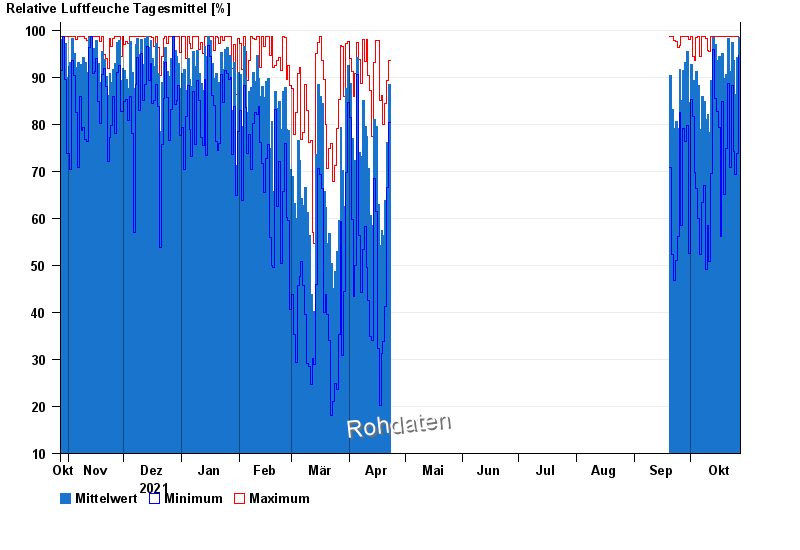
Note: The time series in the selected period has gaps.
| Date | Mean value [%] | Maximum [%] | Minimum [%] |
|---|---|---|---|
| 27.10.2022 | 98.5 | 98.7 | 94.6 |
| 26.10.2022 | 94.3 | 98.7 | 73.8 |
| 25.10.2022 | 86.4 | 98.7 | 69.3 |
| 24.10.2022 | 93.5 | 98.7 | 74.2 |
| 23.10.2022 | 97.4 | 98.7 | 88.3 |
| 22.10.2022 | 91.2 | 98.7 | 70.8 |
| 21.10.2022 | 98.3 | 98.7 | 88.7 |
© Bayerisches Landesamt für Umwelt 2024