
- Start >
- Meteorology >
- Air moisture >
- Unterer Main >
- Bischbrunn >
- Chart of year

Chart of year Bischbrunn
Air moisture from 05.12.2019 to 04.12.2020
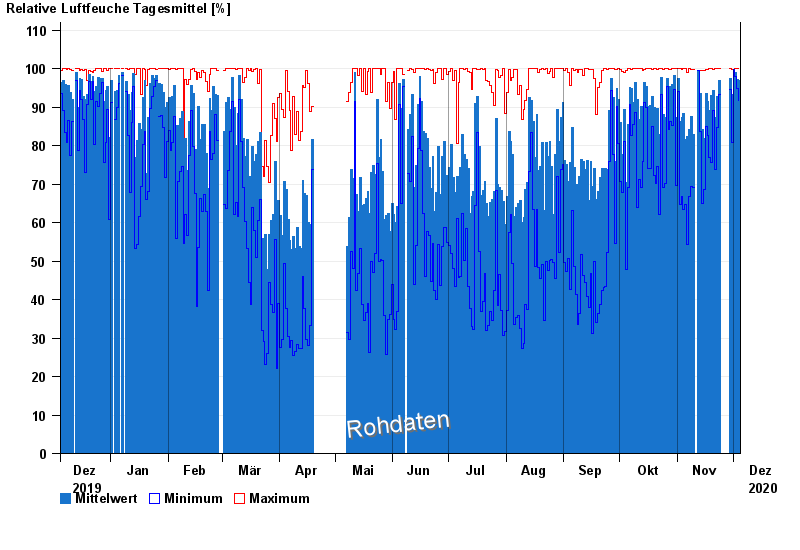
Note: The time series in the selected period has gaps.
| Date | Mean value [%] | Maximum [%] | Minimum [%] |
|---|---|---|---|
| 04.12.2020 | 97.0 | 100.0 | 91.7 |
| 03.12.2020 | 97.2 | 100.0 | 94.8 |
| 02.12.2020 | 99.1 | 100.0 | 98.0 |
| 01.12.2020 | 99.8 | 99.8 | 99.8 |
| 30.11.2020 | 93.4 | 99.7 | 80.9 |
| 29.11.2020 | 97.4 | 100.0 | 94.7 |
| 23.11.2020 | 97.0 | 100.0 | 93.4 |
© Bayerisches Landesamt für Umwelt 2024