
- Start >
- Meteorology >
- Air moisture >
- Isar >
- Forsting >
- Chart of year

Chart of year Forsting
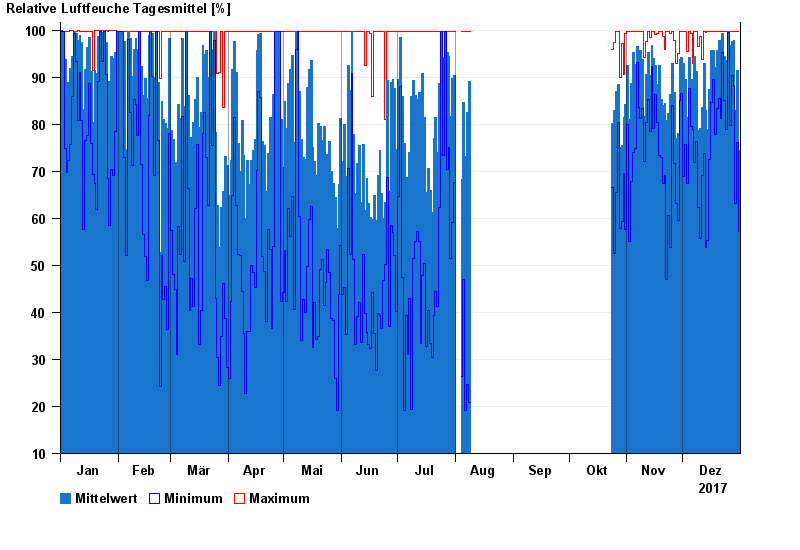
Air moisture from 01.01.2017 to 31.12.2017
Note: The time series in the selected period has gaps.
| Date | Mean value [%] | Maximum [%] | Minimum [%] |
|---|---|---|---|
| 31.12.2017 | 74.4 | 99.7 | 57.3 |
| 30.12.2017 | 91.5 | 99.8 | 76.2 |
| 29.12.2017 | 83.0 | 99.8 | 63.1 |
| 28.12.2017 | 97.9 | 99.8 | 88.0 |
| 27.12.2017 | 97.5 | 99.8 | 90.3 |
| 26.12.2017 | 96.8 | 99.8 | 79.8 |
| 25.12.2017 | 99.7 | 99.8 | 99.5 |
© Bayerisches Landesamt für Umwelt 2024