
- Start >
- Meteorology >
- Air moisture >
- Iller - Lech - Bodensee >
- Trauchgau >
- Chart of year

Chart of year Trauchgau
Air moisture from 01.01.2019 to 31.12.2019
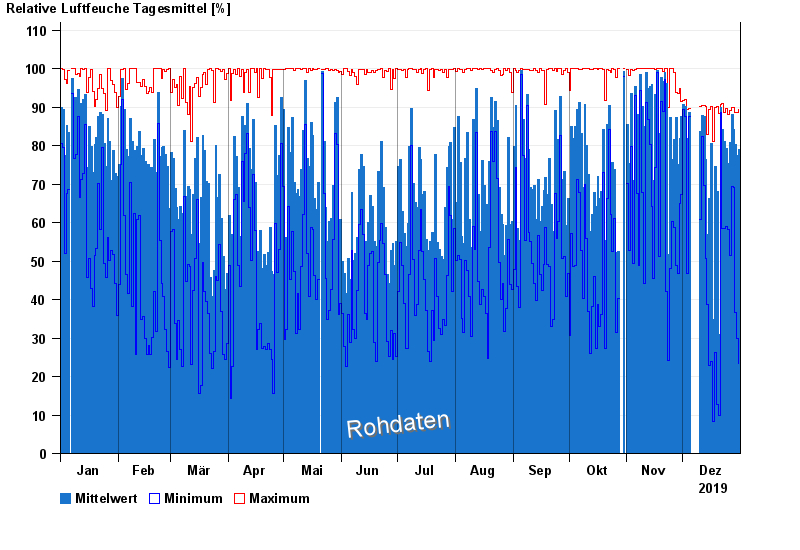
Note: The time series in the selected period has gaps.
| Date | Mean value [%] | Maximum [%] | Minimum [%] |
|---|---|---|---|
| 31.12.2019 | 79.1 | 89.4 | 23.3 |
| 30.12.2019 | 77.4 | 88.6 | 29.9 |
| 29.12.2019 | 80.3 | 88.7 | 36.7 |
| 28.12.2019 | 84.1 | 89.9 | 69.0 |
| 27.12.2019 | 88.1 | 89.9 | 69.4 |
| 26.12.2019 | 80.8 | 89.1 | 51.5 |
| 25.12.2019 | 75.3 | 88.2 | 58.3 |
© Bayerisches Landesamt für Umwelt 2024