
- Start >
- Lakes >
- Waterlevel >
- Iller - Lech - Bodensee >
- Mühlberg >
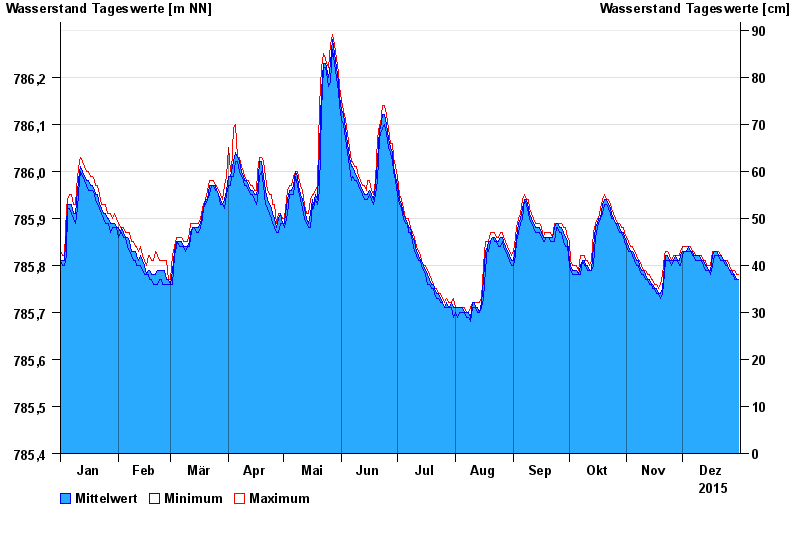
- Chart of year

Chart of year Mühlberg / Bannwaldsee
Waterlevel from 01.01.2015 to 31.12.2015
Linien: keine | Hauptwerte | Meldestufen | mittlerer Seespiegel | Hochwassermarken | historische Ereignisse
| Date | Mean value [m above sealevel] | Maximum [m above sealevel] | Minimum [m above sealevel] |
|---|---|---|---|
| 31.12.2015 | 785.77 | 785.78 | 785.77 |
| 30.12.2015 | 785.77 | 785.78 | 785.77 |
| 29.12.2015 | 785.78 | 785.79 | 785.77 |
| 28.12.2015 | 785.78 | 785.79 | 785.78 |
| 27.12.2015 | 785.79 | 785.79 | 785.78 |
| 26.12.2015 | 785.79 | 785.80 | 785.79 |
| 25.12.2015 | 785.80 | 785.81 | 785.80 |
© Bayerisches Landesamt für Umwelt 2024