
- Start >
- Groundwater >
- Chemistry >
- Unterer Main >
- 4110632100034 >
- Chart of total period

Chart of total period 4110632100034
Data from 17.06.2008 to 08.06.2021
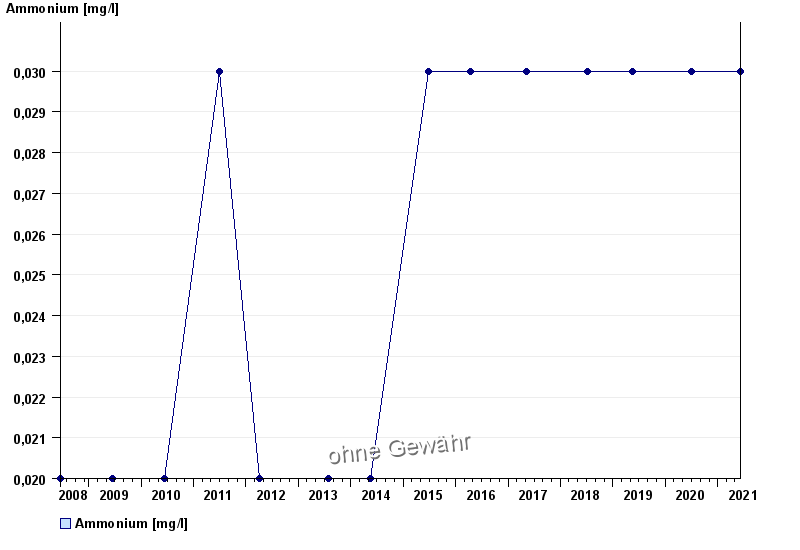
| Date | Ammonium [mg/l] |
|---|---|
| 08.06.2021 | < 0.03 |
| 29.06.2020 | < 0.03 |
| 20.05.2019 | < 0.03 |
| 09.07.2018 | < 0.03 |
| 08.05.2017 | < 0.03 |
| 12.04.2016 | < 0.03 |
| 23.06.2015 | < 0.03 |
© Bayerisches Landesamt für Umwelt 2024