
- Startseite >
- Meteorologie >
- Wind >
- Naab - Regen >
- Allmannsdorf >
- Jahresgrafik

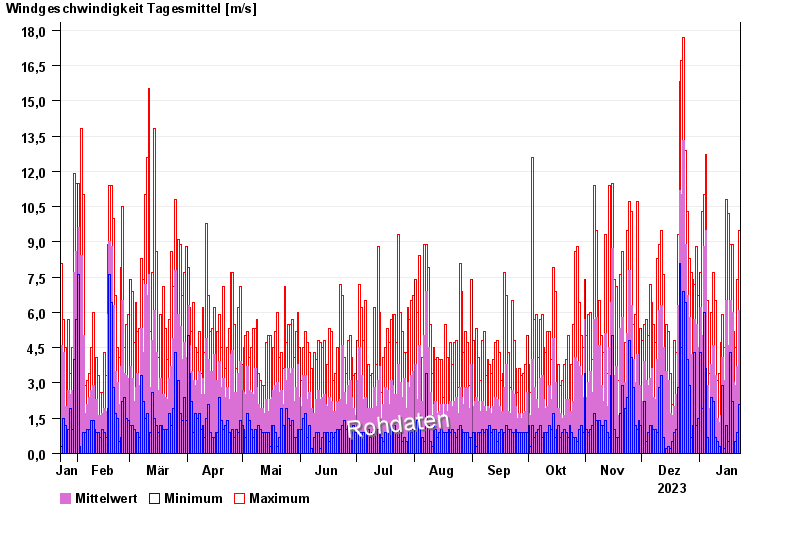
Jahresgrafik Allmannsdorf
Wind vom 23.01.2023 bis zum 22.01.2024
| Datum | Mittelwert [m/s] | Maximum [m/s] | Minimum [m/s] |
|---|---|---|---|
| 22.01.2024 | 6,1 | 9,5 | 2,1 |
| 21.01.2024 | 3,7 | 7,4 | 0,9 |
| 20.01.2024 | 2,9 | 4,5 | 0,5 |
| 19.01.2024 | 3,0 | 5,2 | 0,5 |
| 18.01.2024 | 6,0 | 8,9 | 2,2 |
| 17.01.2024 | 6,5 | 8,9 | 4,3 |
| 16.01.2024 | 4,6 | 10,2 | 0,5 |
© Bayerisches Landesamt für Umwelt 2024