
- Startseite >
- Meteorologie >
- Relative Luftfeuchte >
- Untere Donau >
- Ruhstorf a. d. Rott >
- Jahresgrafik

Jahresgrafik Ruhstorf a. d. Rott
Relative Luftfeuchte vom 10.08.2021 bis zum 09.08.2022
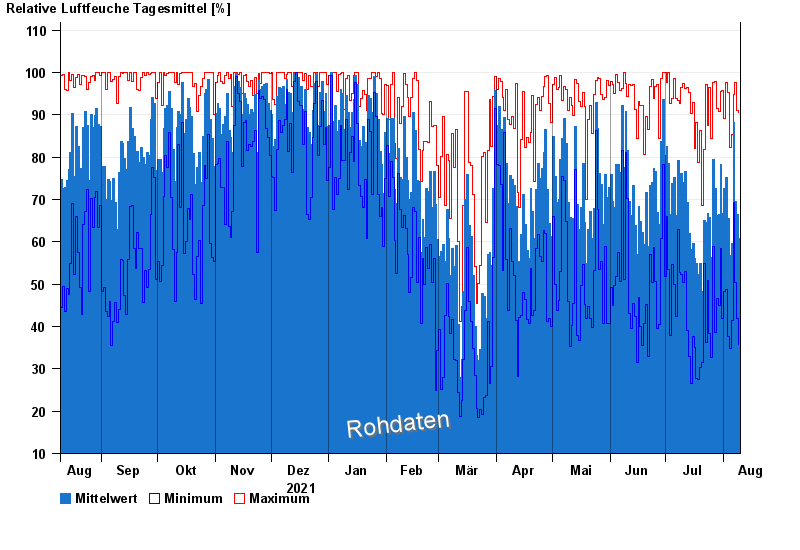
| Datum | Mittelwert [%] | Maximum [%] | Minimum [%] |
|---|---|---|---|
| 09.08.2022 | 60,8 | 90,5 | 35,7 |
| 08.08.2022 | 66,4 | 91,1 | 41,9 |
| 07.08.2022 | 69,5 | 97,6 | 50,4 |
| 06.08.2022 | 88,1 | 94,9 | 69,3 |
| 05.08.2022 | 59,5 | 85,3 | 41,4 |
| 04.08.2022 | 56,8 | 82,4 | 34,7 |
| 03.08.2022 | 65,4 | 95,2 | 37,7 |
© Bayerisches Landesamt für Umwelt 2024