
- Startseite >
- Meteorologie >
- Relative Luftfeuchte >
- Untere Donau >
- Ruhstorf a. d. Rott >
- Jahresgrafik

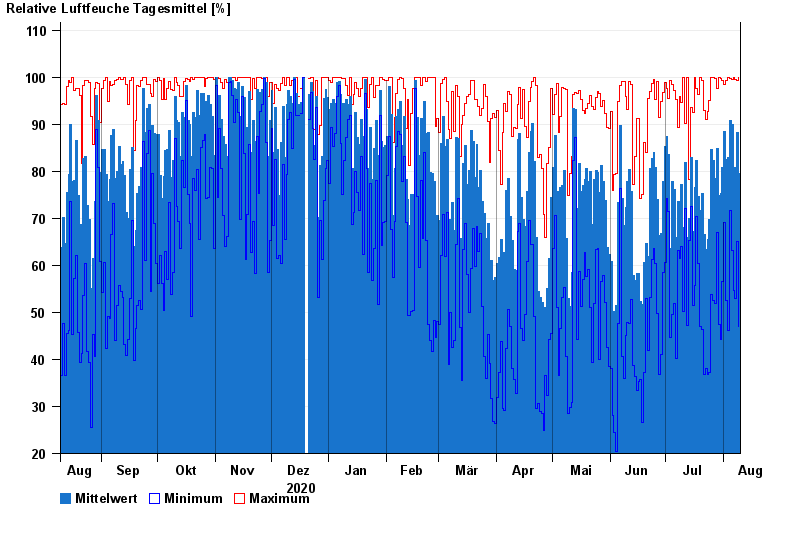
Jahresgrafik Ruhstorf a. d. Rott
Relative Luftfeuchte vom 10.08.2020 bis zum 09.08.2021
Hinweis: Die Zeitreihe im gewählten Zeitraum weist Lücken auf.
| Datum | Mittelwert [%] | Maximum [%] | Minimum [%] |
|---|---|---|---|
| 09.08.2021 | 79,5 | 100,0 | 47,0 |
| 08.08.2021 | 88,2 | 99,2 | 65,0 |
| 07.08.2021 | 80,9 | 99,5 | 53,0 |
| 06.08.2021 | 79,6 | 99,9 | 54,6 |
| 05.08.2021 | 89,9 | 99,6 | 63,2 |
| 04.08.2021 | 90,8 | 99,8 | 71,6 |
| 03.08.2021 | 82,9 | 100,0 | 46,1 |
© Bayerisches Landesamt für Umwelt 2024