
- Startseite >
- Meteorologie >
- Relative Luftfeuchte >
- Untere Donau >
- Ruhstorf a. d. Rott >
- Jahresgrafik

Jahresgrafik Ruhstorf a. d. Rott
Relative Luftfeuchte vom 10.08.2019 bis zum 09.08.2020
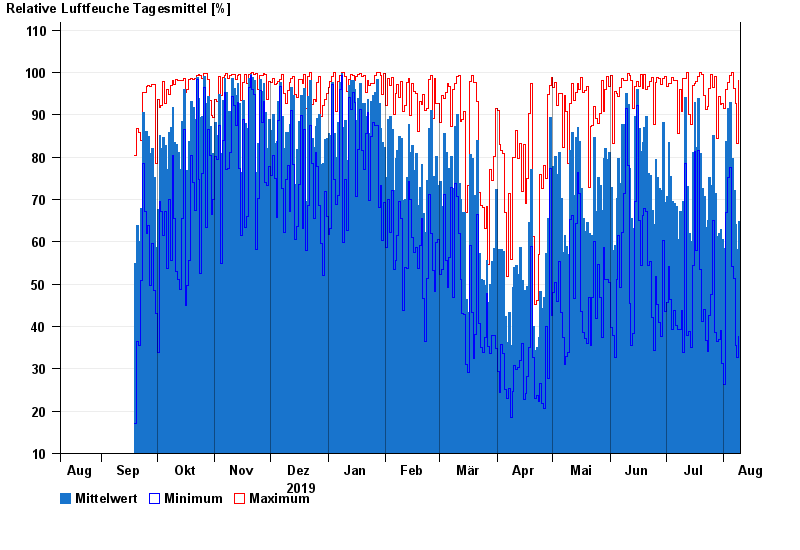
Hinweis: Die Zeitreihe im gewählten Zeitraum weist Lücken auf.
| Datum | Mittelwert [%] | Maximum [%] | Minimum [%] |
|---|---|---|---|
| 09.08.2020 | 64,8 | 98,0 | 37,6 |
| 08.08.2020 | 58,3 | 83,2 | 32,6 |
| 07.08.2020 | 64,1 | 92,7 | 35,6 |
| 06.08.2020 | 72,1 | 96,3 | 51,3 |
| 05.08.2020 | 79,6 | 100,0 | 54,2 |
| 04.08.2020 | 92,9 | 99,3 | 77,5 |
| 03.08.2020 | 91,4 | 97,7 | 75,1 |
© Bayerisches Landesamt für Umwelt 2024