
- Startseite >
- Meteorologie >
- Relative Luftfeuchte >
- Untere Donau >
- Kringell >
- Jahresgrafik

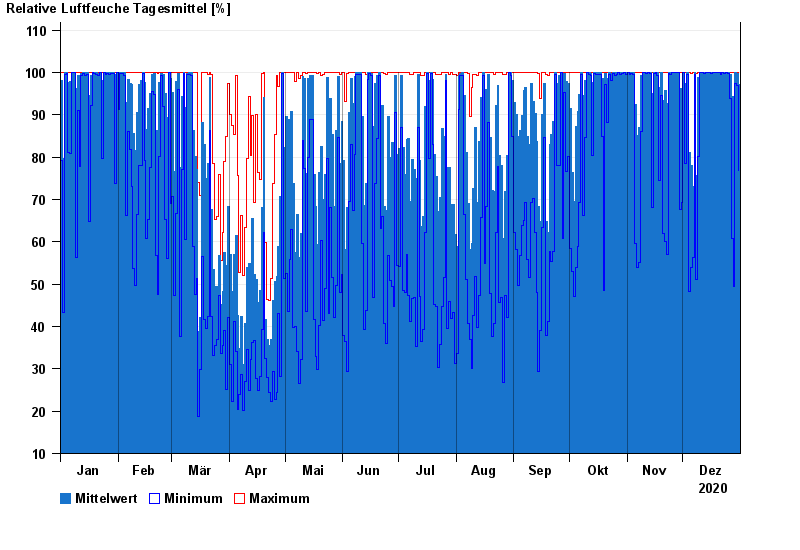
Jahresgrafik Kringell
Relative Luftfeuchte vom 01.01.2020 bis zum 31.12.2020
| Datum | Mittelwert [%] | Maximum [%] | Minimum [%] |
|---|---|---|---|
| 31.12.2020 | 97,2 | 100,0 | 76,8 |
| 30.12.2020 | 99,8 | 100,0 | 97,0 |
| 29.12.2020 | 99,9 | 100,0 | 97,5 |
| 28.12.2020 | 91,4 | 100,0 | 49,4 |
| 27.12.2020 | 94,3 | 100,0 | 60,8 |
| 26.12.2020 | 99,6 | 100,0 | 93,8 |
| 25.12.2020 | 100,0 | 100,0 | 99,7 |
© Bayerisches Landesamt für Umwelt 2024