
- Startseite >
- Meteorologie >
- Relative Luftfeuchte >
- Unterer Main >
- Seligenstadt >
- Jahresgrafik

Jahresgrafik Seligenstadt
Relative Luftfeuchte vom 24.05.2021 bis zum 23.05.2022
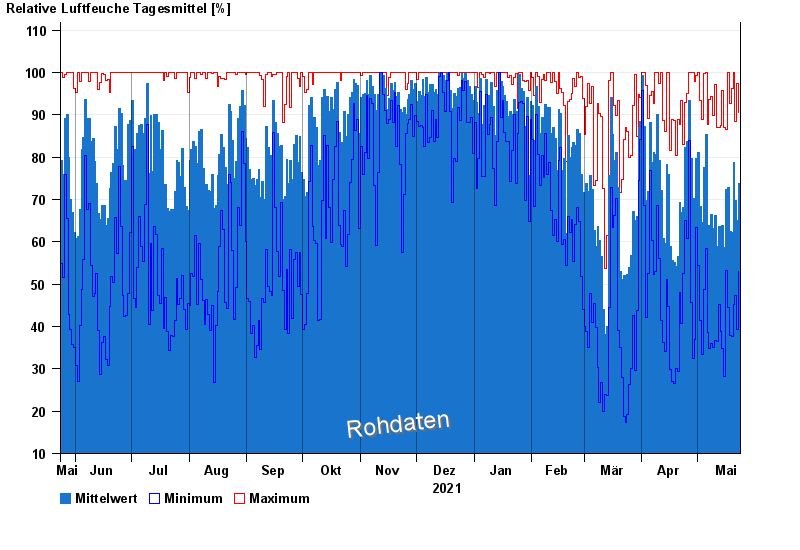
| Datum | Mittelwert [%] | Maximum [%] | Minimum [%] |
|---|---|---|---|
| 23.05.2022 | 73,8 | 90,6 | 53,1 |
| 22.05.2022 | 65,1 | 97,5 | 39,3 |
| 21.05.2022 | 69,7 | 88,4 | 47,4 |
| 20.05.2022 | 78,8 | 100,0 | 45,1 |
| 19.05.2022 | 62,3 | 96,2 | 37,7 |
| 18.05.2022 | 62,5 | 92,6 | 37,8 |
| 17.05.2022 | 72,8 | 99,9 | 44,6 |
© Bayerisches Landesamt für Umwelt 2024