
- Startseite >
- Meteorologie >
- Relative Luftfeuchte >
- Unterer Main >
- Seligenstadt >
- Jahresgrafik

Jahresgrafik Seligenstadt
Relative Luftfeuchte vom 24.05.2022 bis zum 23.05.2023
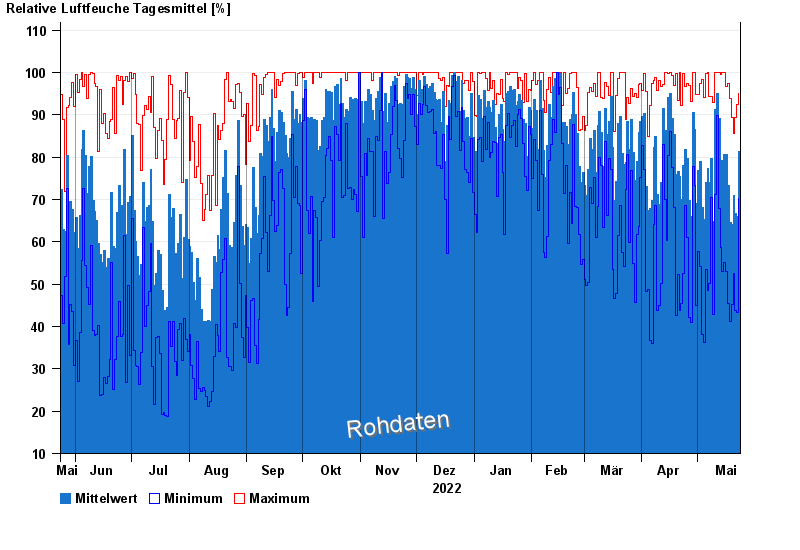
| Datum | Mittelwert [%] | Maximum [%] | Minimum [%] |
|---|---|---|---|
| 23.05.2023 | 81,3 | 95,1 | 70,3 |
| 22.05.2023 | 66,1 | 92,5 | 43,2 |
| 21.05.2023 | 66,8 | 89,3 | 43,8 |
| 20.05.2023 | 70,9 | 85,5 | 52,5 |
| 19.05.2023 | 64,1 | 89,4 | 45,2 |
| 18.05.2023 | 64,5 | 93,8 | 41,1 |
| 17.05.2023 | 73,2 | 97,4 | 45,4 |
© Bayerisches Landesamt für Umwelt 2024