
- Startseite >
- Meteorologie >
- Relative Luftfeuchte >
- Unterer Main >
- Albertshofen >
- Jahresgrafik

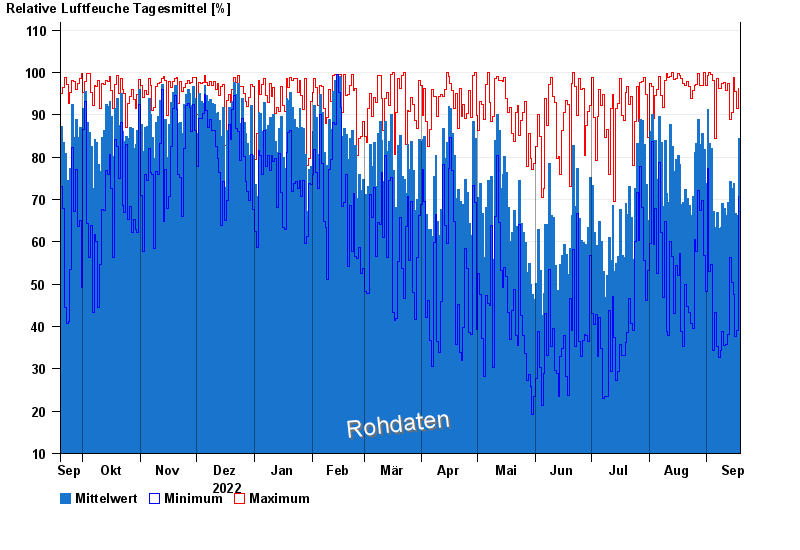
Jahresgrafik Albertshofen
Relative Luftfeuchte vom 19.09.2022 bis zum 18.09.2023
| Datum | Mittelwert [%] | Maximum [%] | Minimum [%] |
|---|---|---|---|
| 18.09.2023 | 84,3 | 96,3 | 70,6 |
| 17.09.2023 | 66,3 | 91,4 | 39,0 |
| 16.09.2023 | 66,7 | 95,6 | 37,7 |
| 15.09.2023 | 73,8 | 98,8 | 47,5 |
| 14.09.2023 | 72,5 | 90,5 | 50,4 |
| 13.09.2023 | 74,3 | 88,9 | 56,2 |
| 12.09.2023 | 69,3 | 97,3 | 38,2 |
© Bayerisches Landesamt für Umwelt 2024