
- Startseite >
- Meteorologie >
- Relative Luftfeuchte >
- Unterer Main >
- Albertshofen >
- Jahresgrafik

Jahresgrafik Albertshofen
Relative Luftfeuchte vom 19.09.2021 bis zum 18.09.2022
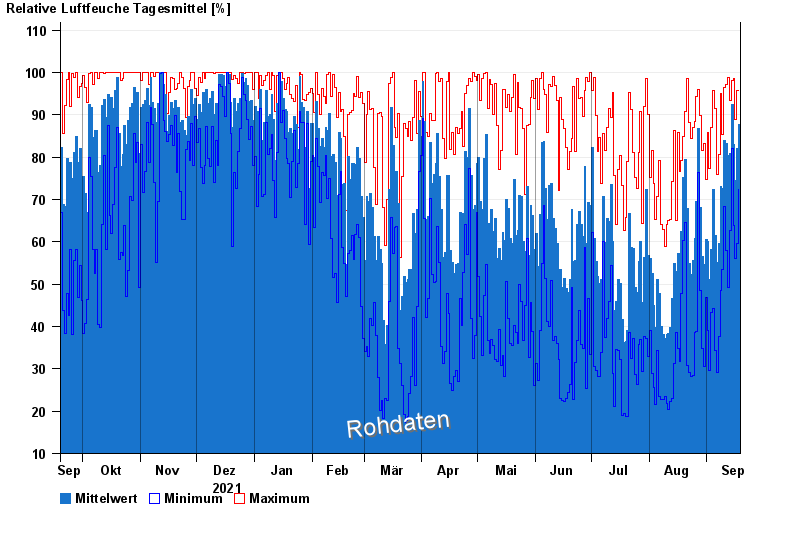
| Datum | Mittelwert [%] | Maximum [%] | Minimum [%] |
|---|---|---|---|
| 18.09.2022 | 87,7 | 95,8 | 72,3 |
| 17.09.2022 | 82,0 | 95,8 | 59,7 |
| 16.09.2022 | 74,5 | 88,9 | 56,1 |
| 15.09.2022 | 83,1 | 98,5 | 63,9 |
| 14.09.2022 | 92,5 | 98,1 | 82,0 |
| 13.09.2022 | 80,9 | 93,3 | 62,6 |
| 12.09.2022 | 80,3 | 98,9 | 49,2 |
© Bayerisches Landesamt für Umwelt 2024