
- Startseite >
- Meteorologie >
- Relative Luftfeuchte >
- Unterer Main >
- Albertshofen >
- Jahresgrafik

Jahresgrafik Albertshofen
Relative Luftfeuchte vom 19.09.2020 bis zum 18.09.2021
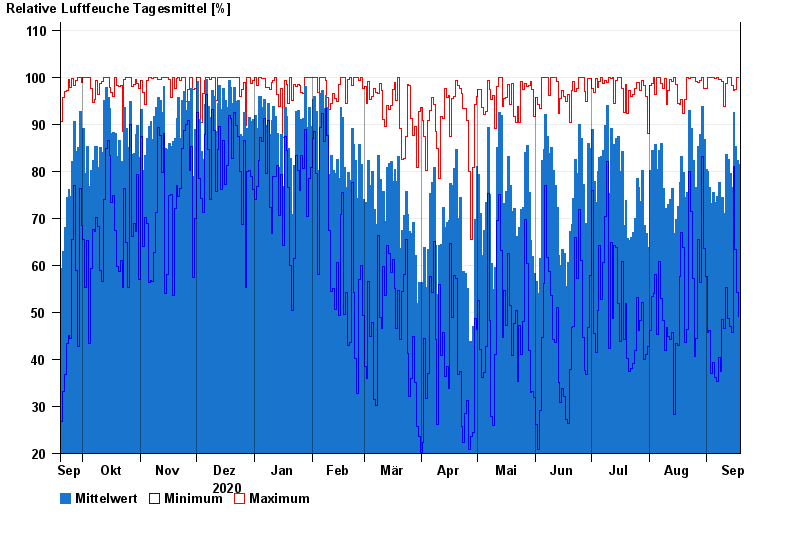
| Datum | Mittelwert [%] | Maximum [%] | Minimum [%] |
|---|---|---|---|
| 18.09.2021 | 81,5 | 100,0 | 49,1 |
| 17.09.2021 | 82,4 | 100,0 | 54,2 |
| 16.09.2021 | 85,2 | 97,4 | 63,3 |
| 15.09.2021 | 92,6 | 97,1 | 81,0 |
| 14.09.2021 | 76,6 | 98,2 | 45,7 |
| 13.09.2021 | 79,5 | 100,0 | 47,0 |
| 12.09.2021 | 82,5 | 100,0 | 48,7 |
© Bayerisches Landesamt für Umwelt 2024