
- Startseite >
- Meteorologie >
- Relative Luftfeuchte >
- Inn >
- Karolinenfeld >
- Jahresgrafik

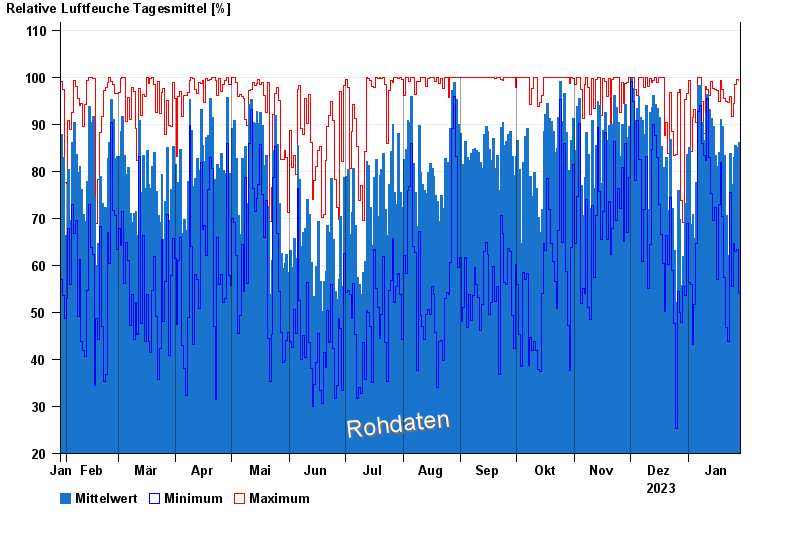
Jahresgrafik Karolinenfeld
Relative Luftfeuchte vom 29.01.2023 bis zum 28.01.2024
| Datum | Mittelwert [%] | Maximum [%] | Minimum [%] |
|---|---|---|---|
| 28.01.2024 | 86,1 | 99,4 | 54,1 |
| 27.01.2024 | 85,1 | 99,6 | 63,4 |
| 26.01.2024 | 85,5 | 98,4 | 62,9 |
| 25.01.2024 | 83,0 | 94,4 | 64,6 |
| 24.01.2024 | 77,2 | 91,7 | 55,6 |
| 23.01.2024 | 83,7 | 95,9 | 75,5 |
| 22.01.2024 | 62,1 | 94,6 | 43,8 |
© Bayerisches Landesamt für Umwelt 2024