
- Startseite >
- Meteorologie >
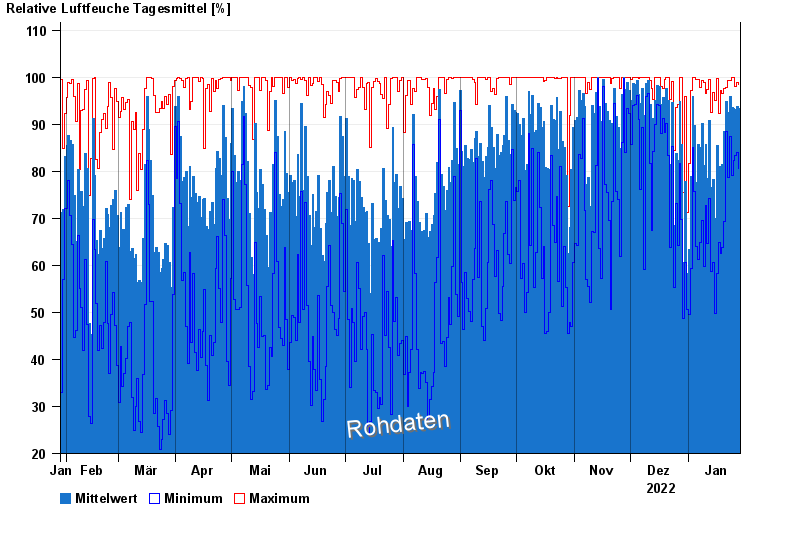
- Relative Luftfeuchte >
- Inn >
- Karolinenfeld >
- Jahresgrafik

Jahresgrafik Karolinenfeld
Relative Luftfeuchte vom 29.01.2022 bis zum 28.01.2023
| Datum | Mittelwert [%] | Maximum [%] | Minimum [%] |
|---|---|---|---|
| 28.01.2023 | 93,3 | 98,5 | 80,6 |
| 27.01.2023 | 93,8 | 98,9 | 84,0 |
| 26.01.2023 | 93,1 | 98,1 | 83,4 |
| 25.01.2023 | 93,3 | 99,9 | 82,3 |
| 24.01.2023 | 93,6 | 99,9 | 79,2 |
| 23.01.2023 | 96,0 | 99,3 | 87,4 |
| 22.01.2023 | 92,4 | 99,3 | 78,7 |
© Bayerisches Landesamt für Umwelt 2024