
- Startseite >
- Meteorologie >
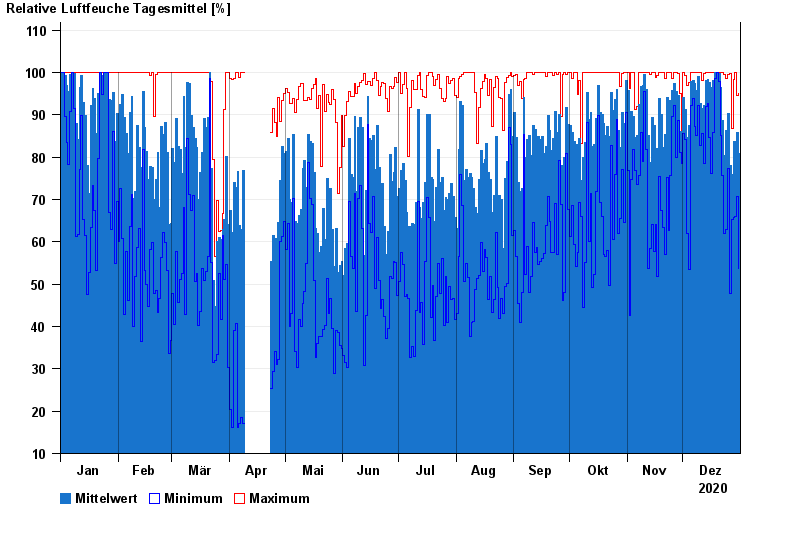
- Relative Luftfeuchte >
- Bayern >
- Schwand >
- Jahresgrafik

Jahresgrafik Schwand
Relative Luftfeuchte vom 01.01.2020 bis zum 31.12.2020
Hinweis: Die Zeitreihe im gewählten Zeitraum weist Lücken auf.
| Datum | Mittelwert [%] | Maximum [%] | Minimum [%] |
|---|---|---|---|
| 31.12.2020 | 80,8 | 95,0 | 53,7 |
| 30.12.2020 | 85,9 | 94,5 | 70,6 |
| 29.12.2020 | 83,8 | 99,9 | 65,9 |
| 28.12.2020 | 83,6 | 98,4 | 65,8 |
| 27.12.2020 | 75,8 | 86,8 | 65,3 |
| 26.12.2020 | 78,1 | 99,7 | 47,8 |
| 25.12.2020 | 90,3 | 99,6 | 77,3 |
© Bayerisches Landesamt für Umwelt 2024