
- Startseite >
- Meteorologie >
- Relative Luftfeuchte >
- Bayern >
- Schwand >
- Jahresgrafik

Jahresgrafik Schwand
Relative Luftfeuchte vom 01.01.2021 bis zum 31.12.2021
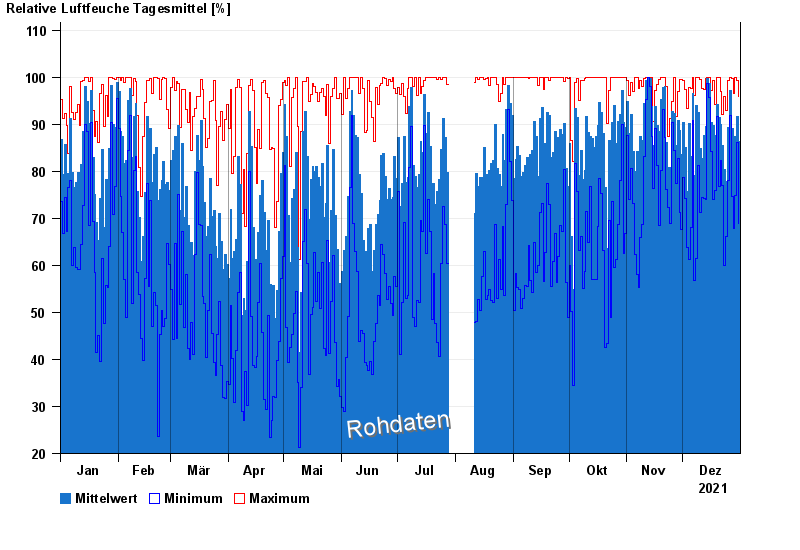
Hinweis: Die Zeitreihe im gewählten Zeitraum weist Lücken auf.
| Datum | Mittelwert [%] | Maximum [%] | Minimum [%] |
|---|---|---|---|
| 31.12.2021 | 86,3 | 95,9 | 68,8 |
| 30.12.2021 | 91,7 | 99,4 | 86,2 |
| 29.12.2021 | 87,5 | 100,0 | 74,9 |
| 28.12.2021 | 85,0 | 96,6 | 67,9 |
| 27.12.2021 | 89,2 | 99,7 | 74,7 |
| 26.12.2021 | 97,1 | 100,0 | 91,8 |
| 25.12.2021 | 89,3 | 99,4 | 78,1 |
© Bayerisches Landesamt für Umwelt 2024