
- Startseite >
- Meteorologie >
- Luftdruck >
- Isar >
- Rauschberg 2 >
- Jahresgrafik

Jahresgrafik Rauschberg 2
Luftdruck vom 01.01.2020 bis zum 31.12.2020
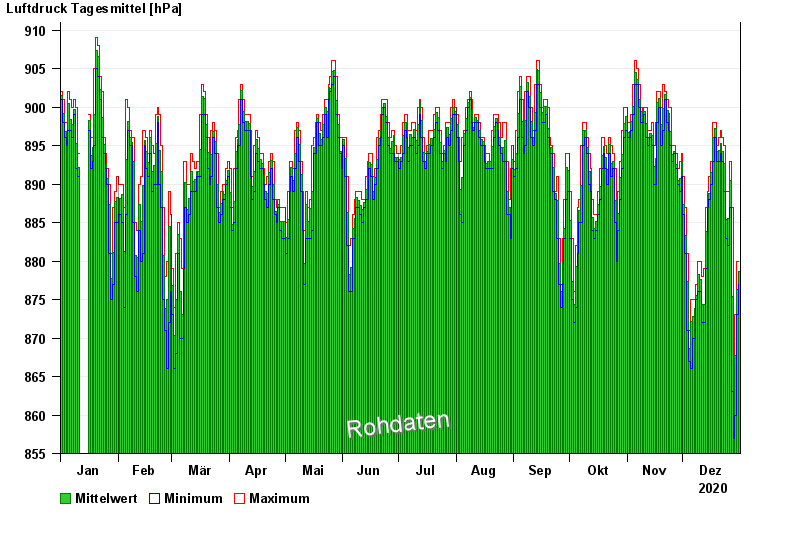
Hinweis: Die Zeitreihe im gewählten Zeitraum weist Lücken auf.
| Datum | Mittelwert [hPa] | Maximum [hPa] | Minimum [hPa] |
|---|---|---|---|
| 31.12.2020 | 878,6 | 880,0 | 877,0 |
| 30.12.2020 | 876,3 | 880,0 | 873,0 |
| 29.12.2020 | 867,7 | 873,0 | 860,0 |
| 28.12.2020 | 859,9 | 863,0 | 857,0 |
| 27.12.2020 | 875,4 | 887,0 | 863,0 |
| 26.12.2020 | 890,5 | 893,0 | 887,0 |
| 25.12.2020 | 885,5 | 889,0 | 882,0 |
© Bayerisches Landesamt für Umwelt 2024