
- Startseite >
- Meteorologie >
- Luftdruck >
- Isar >
- Rauschberg 2 >
- Jahresgrafik

Jahresgrafik Rauschberg 2
Luftdruck vom 01.01.2019 bis zum 31.12.2019
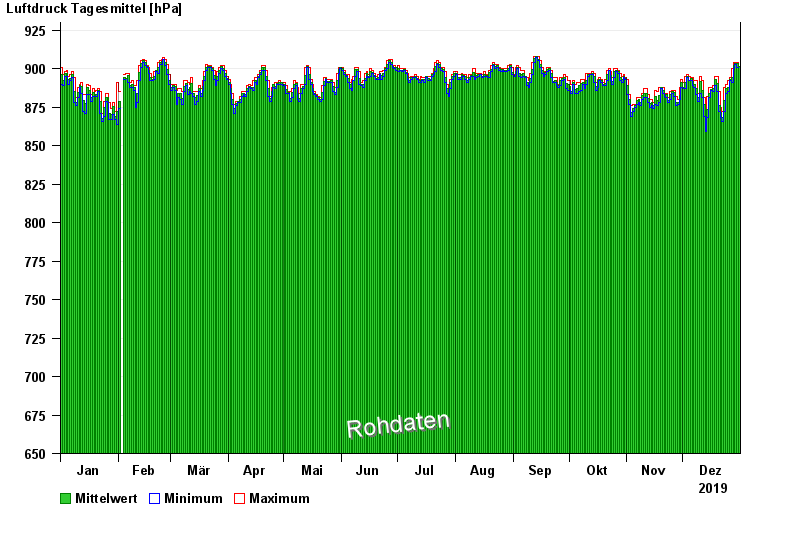
Hinweis: Die Zeitreihe im gewählten Zeitraum weist Lücken auf.
| Datum | Mittelwert [hPa] | Maximum [hPa] | Minimum [hPa] |
|---|---|---|---|
| 31.12.2019 | 901,5 | 902,0 | 901,0 |
| 30.12.2019 | 903,1 | 904,0 | 901,0 |
| 29.12.2019 | 903,5 | 904,0 | 903,0 |
| 28.12.2019 | 902,2 | 904,0 | 900,0 |
| 27.12.2019 | 894,0 | 900,0 | 891,0 |
| 26.12.2019 | 892,9 | 894,0 | 892,0 |
| 25.12.2019 | 887,9 | 892,0 | 885,0 |
© Bayerisches Landesamt für Umwelt 2024