
- Startseite >
- Flüsse >
- Wasserstand >
- Regnitz >
- Trunstadt >
- Jahresgrafik

Jahresgrafik Trunstadt / Main
Wasserstand vom 27.07.2021 bis zum 26.07.2022
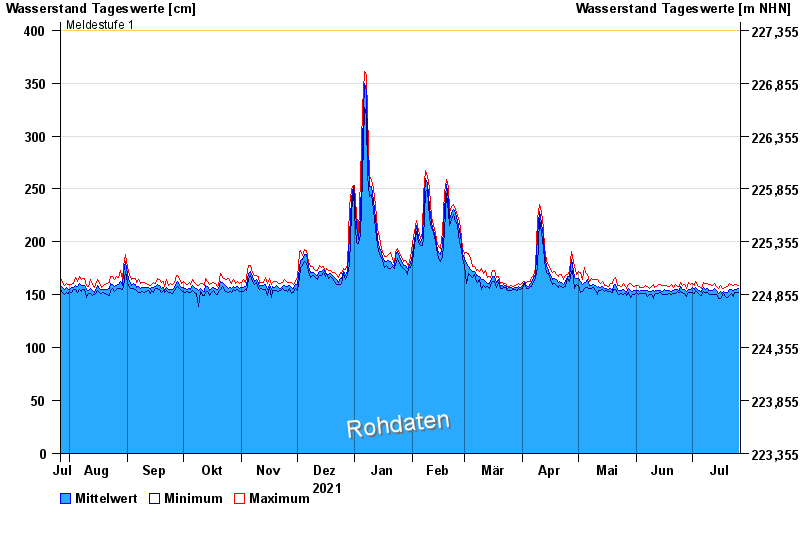
- Meldestufe 1 400 cm
- Meldestufe 2 450 cm
- Meldestufe 3 600 cm
- Meldestufe 4 700 cm
- Hochwassergefahrenfläche HQ100 790 cm
| Datum | Mittelwert [cm] | Maximum [cm] | Minimum [cm] |
|---|---|---|---|
| 26.07.2022 | 156 | 159 | 152 |
| 25.07.2022 | 155 | 160 | 152 |
| 24.07.2022 | 155 | 160 | 152 |
| 23.07.2022 | 154 | 159 | 148 |
| 22.07.2022 | 155 | 160 | 151 |
| 21.07.2022 | 155 | 161 | 149 |
| 20.07.2022 | 152 | 158 | 147 |
© Bayerisches Landesamt für Umwelt 2024