
- Startseite >
- Flüsse >
- Wasserstand >
- Regnitz >
- Trunstadt >
- Jahresgrafik

Jahresgrafik Trunstadt / Main
Wasserstand vom 18.10.2021 bis zum 17.10.2022
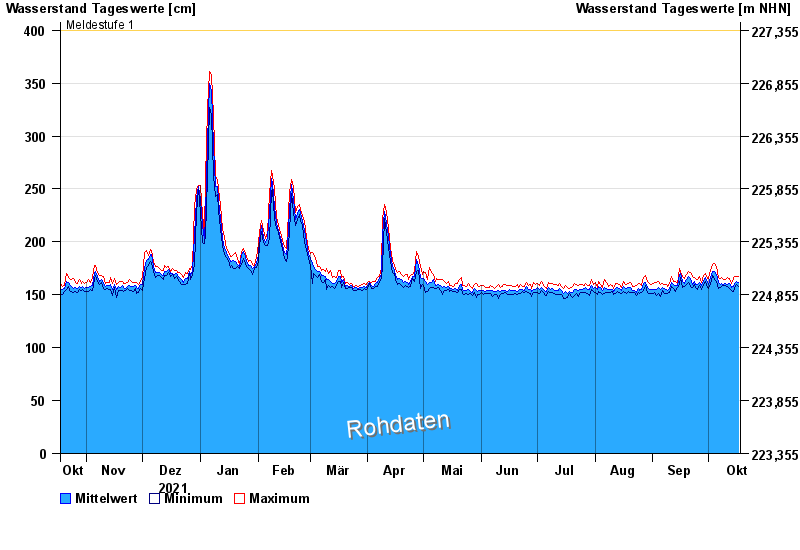
- Meldestufe 1 400 cm
- Meldestufe 2 450 cm
- Meldestufe 3 600 cm
- Meldestufe 4 700 cm
- Hochwassergefahrenfläche HQ100 790 cm
| Datum | Mittelwert [cm] | Maximum [cm] | Minimum [cm] |
|---|---|---|---|
| 17.10.2022 | 162 | 167 | 158 |
| 16.10.2022 | 163 | 167 | 160 |
| 15.10.2022 | 161 | 167 | 156 |
| 14.10.2022 | 158 | 165 | 153 |
| 13.10.2022 | 157 | 161 | 154 |
| 12.10.2022 | 161 | 165 | 156 |
| 11.10.2022 | 160 | 166 | 158 |
© Bayerisches Landesamt für Umwelt 2024