
- Startseite >
- Flüsse >
- Wasserstand >
- Regnitz >
- Schnaittach Markt >
- Jahresgrafik

Jahresgrafik Schnaittach Markt / Schnaittach
Wasserstand vom 27.09.2021 bis zum 26.09.2022
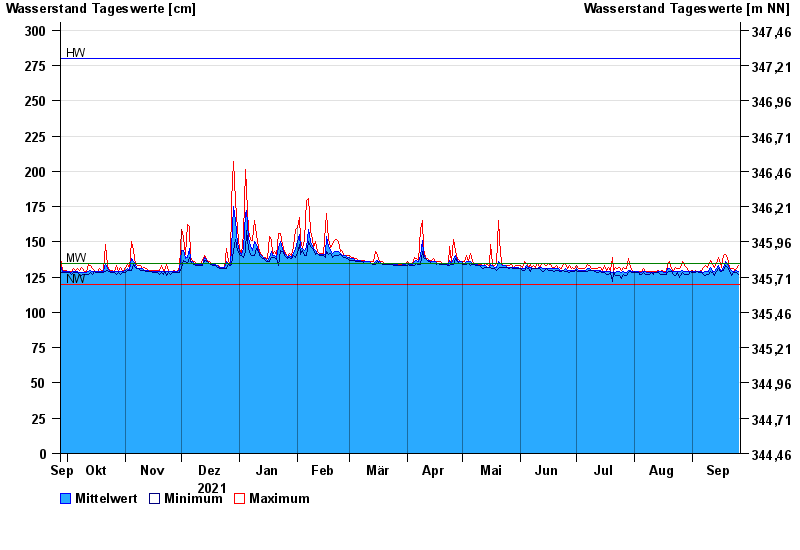
| Datum | Mittelwert [cm] | Maximum [cm] | Minimum [cm] |
|---|---|---|---|
| 26.09.2022 | 129 | 133 | 127 |
| 25.09.2022 | 130 | 131 | 128 |
| 24.09.2022 | 129 | 130 | 128 |
| 23.09.2022 | 129 | 131 | 128 |
| 22.09.2022 | 130 | 131 | 126 |
| 21.09.2022 | 131 | 132 | 130 |
| 20.09.2022 | 134 | 139 | 132 |
© Bayerisches Landesamt für Umwelt 2024