
- Startseite >
- Flüsse >
- Wasserstand >
- Regnitz >
- Roth Bleiche >
- Jahresgrafik

Jahresgrafik Roth Bleiche / Roth
Wasserstand vom 29.10.2019 bis zum 28.10.2020
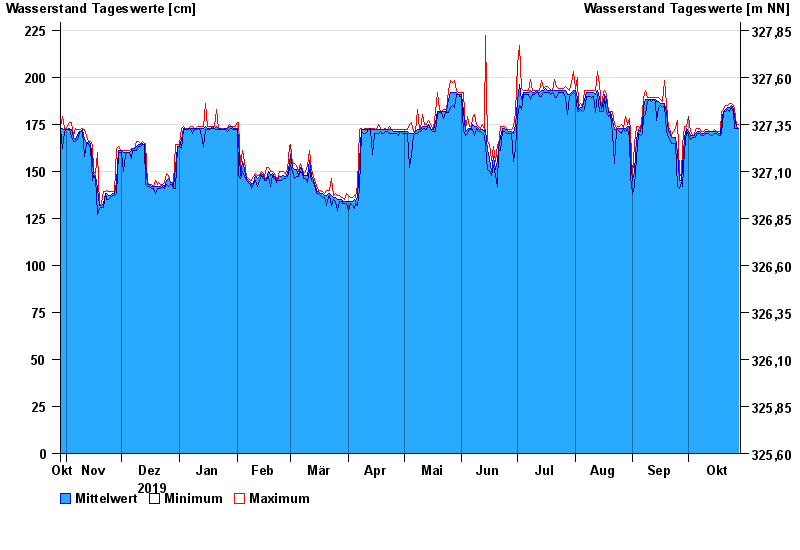
| Datum | Mittelwert [cm] | Maximum [cm] | Minimum [cm] |
|---|---|---|---|
| 28.10.2020 | 173 | 175 | 173 |
| 27.10.2020 | 174 | 175 | 173 |
| 26.10.2020 | 179 | 183 | 173 |
| 25.10.2020 | 183 | 185 | 181 |
| 24.10.2020 | 185 | 186 | 184 |
| 23.10.2020 | 184 | 186 | 182 |
| 22.10.2020 | 184 | 185 | 183 |
© Bayerisches Landesamt für Umwelt 2024