
- Startseite >
- Flüsse >
- Wasserstand >
- Regnitz >
- Roth Bleiche >
- Jahresgrafik

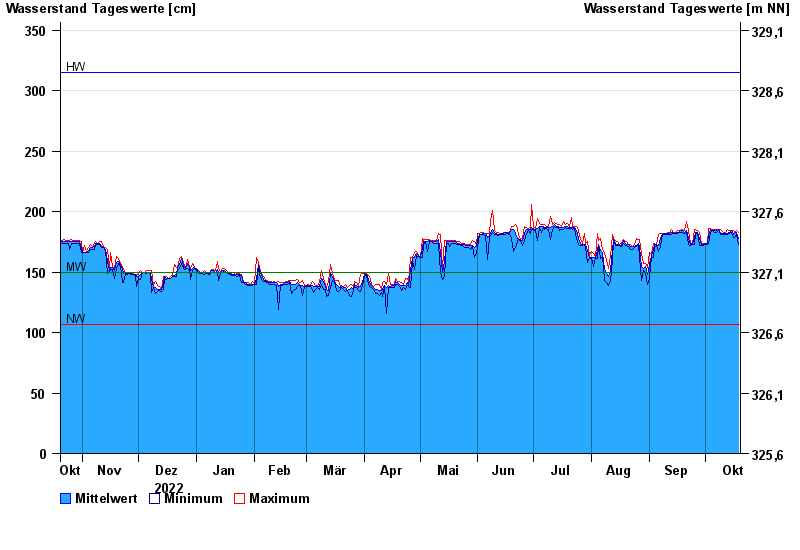
Jahresgrafik Roth Bleiche / Roth
Wasserstand vom 20.10.2022 bis zum 19.10.2023
| Datum | Mittelwert [cm] | Maximum [cm] | Minimum [cm] |
|---|---|---|---|
| 19.10.2023 | 178 | 183 | 173 |
| 18.10.2023 | 183 | 184 | 181 |
| 17.10.2023 | 182 | 183 | 179 |
| 16.10.2023 | 181 | 184 | 179 |
| 15.10.2023 | 184 | 184 | 183 |
| 14.10.2023 | 183 | 184 | 182 |
| 13.10.2023 | 182 | 185 | 181 |
© Bayerisches Landesamt für Umwelt 2024