
- Startseite >
- Flüsse >
- Wasserstand >
- Regnitz >
- Roth Bleiche >
- Jahresgrafik

Jahresgrafik Roth Bleiche / Roth
Wasserstand vom 29.10.2022 bis zum 28.10.2023
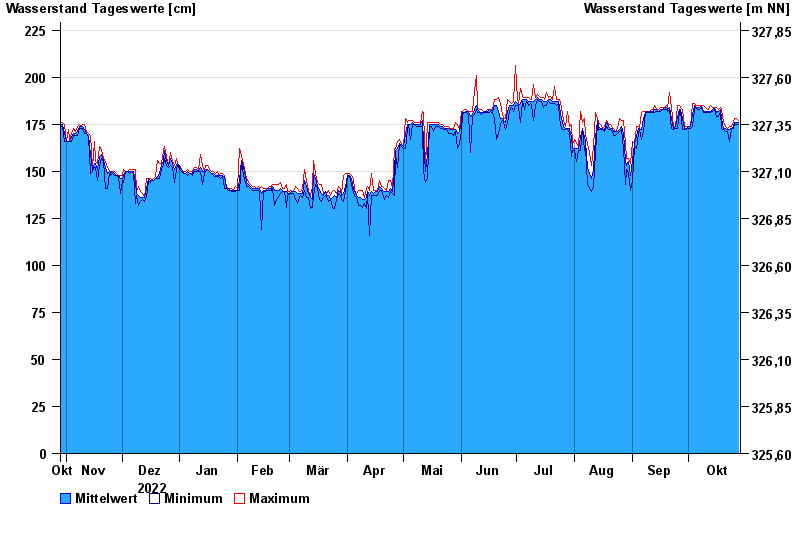
- Hochwassergefahrenfläche HQhäufig 340 cm
- Hochwassergefahrenfläche HQ100 410 cm
| Datum | Mittelwert [cm] | Maximum [cm] | Minimum [cm] |
|---|---|---|---|
| 28.10.2023 | 176 | 177 | 175 |
| 27.10.2023 | 176 | 178 | 175 |
| 26.10.2023 | 176 | 178 | 175 |
| 25.10.2023 | 174 | 176 | 173 |
| 24.10.2023 | 173 | 174 | 172 |
| 23.10.2023 | 172 | 174 | 166 |
| 22.10.2023 | 172 | 173 | 171 |
© Bayerisches Landesamt für Umwelt 2024