
- Startseite >
- Flüsse >
- Wasserstand >
- Regnitz >
- Roth Bleiche >
- Jahresgrafik

Jahresgrafik Roth Bleiche / Roth
Wasserstand vom 22.10.2020 bis zum 21.10.2021
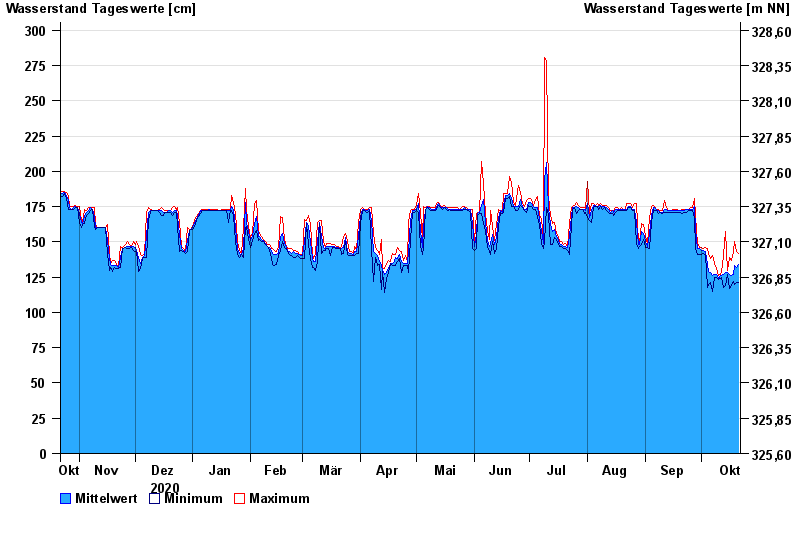
- Hochwassergefahrenfläche HQhäufig 340 cm
- Hochwassergefahrenfläche HQ100 410 cm
| Datum | Mittelwert [cm] | Maximum [cm] | Minimum [cm] |
|---|---|---|---|
| 21.10.2021 | 134 | 142 | 121 |
| 20.10.2021 | 132 | 143 | 121 |
| 19.10.2021 | 133 | 150 | 120 |
| 18.10.2021 | 127 | 143 | 122 |
| 17.10.2021 | 126 | 137 | 119 |
| 16.10.2021 | 127 | 139 | 117 |
| 15.10.2021 | 128 | 130 | 127 |
© Bayerisches Landesamt für Umwelt 2024